Smart TP Manager - FREE Edition📘 Smart TP Manager - User Guide
🎯 Parameter Adaptation by Timeframe
IMPORTANT: Default parameters are optimized for M5 (5 minutes). If you trade on other timeframes, you MUST adapt the parameters for better results.
📊 Recommended Settings Table
M1 (1 minute) - Ultra Scalping
ATR SL Multiplier: 1.5 - 1.8
Number of TPs: 3 - 4
Base RR: 0.4 - 0.5
Confirmation Bars: 2
Cooldown: 3 - 5 bars
Breakeven: Enable after TP1
Profile: Very fast trades, immediate exits, tight SL
M5 (5 minutes) - Scalping ✅ DEFAULT
ATR SL Multiplier: 1.8 - 2.0
Number of TPs: 4 - 5
Base RR: 0.5 - 0.6
Confirmation Bars: 2 - 3
Cooldown: 5 - 8 bars
Breakeven: Enable after TP1 or TP2
Profile: Standard scalping, balance between speed and security
M15 (15 minutes) - Intraday
ATR SL Multiplier: 2.0 - 2.2
Number of TPs: 5 - 6
Base RR: 0.6 - 0.8
Confirmation Bars: 3
Cooldown: 8 - 10 bars
Breakeven: Enable after TP2
Profile: Intraday trading, 3-8 trades per day
H1 (1 hour) - Swing
ATR SL Multiplier: 2.2 - 2.5
Number of TPs: 5 - 6
Base RR: 0.8 - 1.0
Confirmation Bars: 3 - 4
Cooldown: 10 - 15 bars
Breakeven: Enable after TP2 or TP3
Profile: Swing trading, 1-3 trades per day
H4 (4 hours) - Position
ATR SL Multiplier: 2.5 - 3.0
Number of TPs: 6
Base RR: 1.0 - 1.2
Confirmation Bars: 4 - 5
Cooldown: 15 - 20 bars
Breakeven: Enable after TP3
Profile: Position trading, multi-day trades
🔍 Adaptation Logic
General Rule:
LOWER Timeframe → TIGHTER Parameters
HIGHER Timeframe → WIDER Parameters
Why Adapt?
1. ATR SL Multiplier
M1: Very volatile market, fast moves → Tight SL (1.5-1.8)
H4: Slow moves, breathing room needed → Wide SL (2.5-3.0)
2. Number of TPs
M1: Quick exits before reversal → 3-4 TPs
H4: Let profits run → 6 TPs
3. Base RR
M1: Close targets, quick exits → 0.4-0.5
H4: Ambitious targets, patience → 1.0-1.2
4. Confirmation Bars
M1: Fast entry, 2 candles enough
H4: Strong confirmation needed, 4-5 candles
5. Cooldown
M1: Multiple trades per hour possible → 3-5 bars
H4: Important spacing between trades → 15-20 bars
6. Breakeven
M1: Immediate protection after TP1
H4: Let trade breathe, BE after TP3
💡 Real Examples
Example 1: Gold M1 Scalping
Goal: 10-20 trades/day, ultra-fast exits
Recommended Parameters:
- ATR SL: 1.6
- TPs: 4
- Base RR: 0.5
- Confirmation: 2
- Cooldown: 5
- BE: ON after TP1
Expected Results:
- Winrate: 40-50%
- Net P/L: +3 to +6R per day
- SL: 10-15 pips
- TP1: 5-8 pips (quick exit)
Example 2: Gold M15 Day Trading
Goal: 3-6 trades/day, let it breathe
Recommended Parameters:
- ATR SL: 2.1
- TPs: 5
- Base RR: 0.7
- Confirmation: 3
- Cooldown: 10
- BE: ON after TP2
Expected Results:
- Winrate: 50-60%
- Net P/L: +5 to +10R per day
- SL: 20-30 pips
- TP1: 14-21 pips
Example 3: Gold H1 Swing Trading
Goal: 1-2 trades/day, maximum patience
Recommended Parameters:
- ATR SL: 2.4
- TPs: 6
- Base RR: 0.9
- Confirmation: 4
- Cooldown: 12
- BE: ON after TP2
Expected Results:
- Winrate: 55-65%
- Net P/L: +8 to +15R per week
- SL: 40-60 pips
- TP1: 36-54 pips
⚠️ Common Mistakes to Avoid
❌ MISTAKE #1: Using same parameters on all timeframes
M1 with ATR SL 2.5 → SL too wide, huge losses
H4 with ATR SL 1.5 → SL too tight, constant stop outs
❌ MISTAKE #2: Too many TPs on low timeframe
M1 with 6 TPs → Impossible to reach all TPs
❌ MISTAKE #3: Too long confirmation on M1
M1 with 5 confirmation bars → Misses all fast moves
❌ MISTAKE #4: Too short cooldown on H4
H4 with 3 bars cooldown → Overtrading, too many poor-quality trades
🎯 Testing Methodology
Step 1: Start with recommended values
Use the table above according to your timeframe
Step 2: Backtest on minimum 100 trades
Observe:
Winrate
Net P/L in R
Number of BE hits
Trade frequency
Step 3: Adjust based on results
If too many SL hits:
↑ Increase ATR SL Multiplier by +0.2
↑ Increase Confirmation Bars by +1
If not enough trades:
↓ Reduce Cooldown by -2
↓ Reduce Confirmation Bars by -1
If TPs never reached:
↓ Reduce Number of TPs by -1
↓ Reduce Base RR by -0.1
If too many BE but no real wins:
↑ Increase Base RR by +0.1
Disable BE temporarily
📈 Performance Tracking
Key indicators by timeframe:
TFTrades/DayMin WinrateNet P/L/DayAvg SL (pips)M110-2040%+3R10-15M55-1245%+4R15-20M153-850%+5R20-30H11-455%+3R40-60H40.5-260%+2R80-120
🚀 Final Advice
DO NOT USE THE SAME PARAMETERS ON DIFFERENT TIMEFRAMES!
Each timeframe has its own dynamics. Adapting parameters is not optional, it's MANDATORY for optimal results.
Different timeframe = Different parameters = Different results
Quick Reference Chart
M1 → AGGRESSIVE (tight SL, few TPs, quick BE)
M5 → BALANCED (default settings)
M15 → MODERATE (wider SL, more TPs)
H1 → PATIENT (wide SL, max TPs, late BE)
H4 → CONSERVATIVE (very wide SL, all TPs, very late BE)
📝 Best Practices
Always backtest on your specific timeframe before live trading
Start conservative - use higher ATR multipliers first
Track your stats - Wins, Losses, BE, Net P/L
Adjust gradually - change one parameter at a time
Respect your timeframe - don't force H4 parameters on M1
Use breakeven wisely - protect profits but don't choke trades
Monitor cooldown - too many trades = lower quality
🎓 Understanding the Strategy
EMA 9/21 Crossover
BUY: EMA9 crosses above EMA21
SELL: EMA9 crosses below EMA21
RSI Filter
Avoids overbought (>70) for longs
Avoids oversold (<30) for shorts
Confirmation System
Requires X consecutive candles meeting conditions
Reduces false signals
Take Profit Structure
Non-linear TP levels
TP1: 0.5R (default)
TP2: 1.0R
TP3: 1.5R
TP4: 2.0R
TP5: 2.5R
Risk Management
ATR-based stop loss (adapts to volatility)
Optional breakeven after specified TP
Cooldown prevents overtrading
🌟 Pro Tips
Gold (XAUUSD) specific: Use tighter parameters than forex pairs
NY Session: More volatility, tighter SL recommended
Asian Session: Lower volatility, consider skipping or wider SL
News events: Increase cooldown before/after major news
Trending markets: Increase Number of TPs
Ranging markets: Decrease Number of TPs, faster exits
Happy Trading! 🎯
Remember: Past performance does not guarantee future results. Always use proper risk management and never risk more than you can afford to lose.
在脚本中搜索"take profit"

Sani Momentum Target System [wjdtks255]Sani Momentum Target System Explanation & Trading Method
The Sani Momentum Target System is a momentum-based trading indicator that helps traders identify trend changes and determine precise entry points, stop-loss levels, and multiple profit targets.
Key Features:
Smoothed Price Calculation: Utilizes a glide-like smoothing function to reduce noise in price data.
Moving Averages: Calculates fast and slow EMAs on the smoothed price; the difference creates an oscillator.
Signal Line: A simple moving average smooths the oscillator to generate a signal line.
Trend Signals:
Buy signal when oscillator crosses above the signal line.
Sell signal when oscillator crosses below the signal line.
Entry, Stop Loss, Target Levels:
Entry price is set at current close on signal.
Stop loss is set by multiplying ATR by 2 against trend direction.
Three take profit targets (T1, T2, T3) are set by user-defined multiples of ATR.
Visual Display: Includes colored horizontal lines and labels for entry, stop loss, and targets.
Bars are colored by trend direction, and triangular markers show buy/sell signals.
How To Use This Indicator:
Entry: Place trades in the direction of the signal (long on buy, short on sell).
Stop Loss: Use the ATR-based stop loss line to minimize downside risk.
Profit Taking: Scale out profits or exit trades at target levels T1, T2, and T3.
Trend Confirmation: Confirm with oscillator trend direction before entry to avoid false signals.
Parameter Adjustment: Modify smoothing lengths, ATR period, and target multipliers to fit your trading style and timeframe.
Final Notes:
This indicator streamlines momentum trading by providing clear price targets and risk levels visually.
Always backtest strategies and apply proper risk management.
Suitable across asset classes: stocks, forex, cryptocurrencies.
If you want detailed guidance or customization, feel free to ask!

Market Echo Screener [BigBeluga]
The Market Echo Screener is a structured multi-asset dashboard capable of tracking up to 15 symbols simultaneously .
Designed to condense complex market data into an actionable format. Each column represents a specialized calculation, giving traders insight into signals, phases, retests, and volatility — all updated in real time.
For each symbol, it displays a full set of analytics: trend signals, take profit progression, wave structure, equilibrium pulls, volatility-adjusted flows, smart band retests, volatility regimes, and live price context — all condensed into one unified table.
Instead of flipping through multiple charts, traders get an instant overview of market dynamics across an entire watchlist, making it easier to spot alignment and high-probability opportunities.
⬤ Trend Signals
This column is powered by a low-pass digital trend filter that smooths short-term fluctuations and isolates directional momentum.
It produces Buy and Sell signals when price crosses adaptive thresholds relative to the smoothed baseline. Stronger “+” signals appear when slope acceleration or momentum divergence confirms additional conviction.
• Uses recursive filtering to eliminate noise.
• Signal strength is determined by the magnitude of deviation from the baseline.
• Tracks how many bars back the signal occurred, using a bar-counting algorithm.
• Combines both normal and power signals to reflect phases of market conviction.
⬤ TPs (Take Profits)
The take profit ladder is generated through an adaptive volatility-projection model .
When a signal fires, projected levels are based on volatility-weighted extensions. Each level (TP1–TP6) represents an incrementally wider confidence band, dynamically recalculated with every new bar.
• Uses volatility-normalized ranges for TP distances.
• Level activation is sequential, progressing as price reaches thresholds.
• Reset occurs when opposite signals are detected.
• Higher TPs imply extended momentum runs, while early TP triggers highlight conservative exits.
⬤ ActionWave
The ActionWave column applies a dual-smoothing algorithm combining custom MA stacks and polynomial regression to capture the underlying wave structure.
It identifies macro phases (Bullish ∆ / Bearish ∇) and flags retests when price folds back into the average after expansion.
• Wave slope is calculated using gradient differentials.
• Retests are confirmed within a bar-window threshold (e.g., 20–25 bars).
• Distinguishes continuation from exhaustion by analyzing whether slope remains positive/negative.
• Provides a clean map of trend rhythm without intrabar noise.
⬤ Magnet
The Magnet measure calculates a dynamic equilibrium band around price.
By averaging the midpoints of recent high–low ranges and weighting them by volatility, it defines a “fair zone” where price tends to trend and mean-revert.
• Bullish/Bearish status is derived from price position relative to the equilibrium mean.
• Retests occur when price leaves the zone and then re-enters within a tolerance band.
• Incorporates a mean-reversion index to highlight strength of pull.
• Acts as a gravitational anchor, showing when price is likely to snap back.
⬤ FlowTrend
FlowTrend is calculated using volatility and noise adjusted envelope bands .
It determines the active market flow by testing whether price consistently holds above or below the smoothed envelope. Retests are logged when price touches the envelope and respects trend direction.
• Bands expand/contract based on ATR and rolling variance.
• Flow state = Bullish if closing above upper envelope, Bearish if below.
• Retests validated only if trend slope and band alignment remain intact.
• Helps identify continuation setups by filtering false flips.
⬤ Smart Bands
Smart Bands employ an adaptive trailing stop framework that shifts with volatility and momentum.
Price interaction with these bands is tracked for bullish (∆) or bearish (∇) retests, highlighting whether the current move has revalidated at its volatility boundary.
• Bands derived from trailing volatility-adjusted stops.
• Upward retest fires when price tests support bands during uptrend.
• Downward retest occurs when resistance bands are tapped in downtrend.
• Provides structured “confirmation points” that validate signals.
⬤ Volatility
Volatility is measured via a hybrid standard deviation logic .
First, the standard deviation of closing prices over 10 bars is scaled by a factor, then normalized against its own 20-bar rolling standard deviation. The result is converted into a 0–100 index, producing three regimes:
❄️ Calm (<50): low dispersion, mean-reversion conditions dominate.
⚠️ Elevated (50–70): directional expansion likely, watch for breakout tension.
💥 Explosive (>70): strong dispersion, trend-following setups favored.
• Uses layered smoothing to dampen noise.
• Normalization ensures comparability across different assets.
• Acts as a meta-filter for selecting strategy type (range vs. momentum).
⬤ Price
The price column displays the latest close rounded to the nearest tick size.
It is color-coded by candle bias: green for bullish closes, red for bearish closes.
• Tick normalization ensures clean display across assets with different decimal precision.
• Color-coding gives instant sentiment context.
• Serves as the anchor reference for all other metrics in the row.
The Market Echo Screener is not a simple signal table — it’s a layered analytics framework.
Each column is driven by technical calculations: smoothing filters, volatility projections, equilibrium models, and adaptive band logic. Together, they create a unified lens on multiple assets, allowing traders to rapidly identify alignment, filter out noise, and focus on the clearest opportunities.

ATR (No Gap) - Advanced Volatility IndicatorA customizable Average True Range indicator that eliminates gap distortion between trading sessions, providing cleaner volatility measurements for intraday and swing traders.
Key Features:
Gap Filtering: Optional toggle to ignore overnight/weekend gaps that distort volatility readings
EMA Smoothing: Defaults to EMA for more responsive volatility tracking (also supports RMA and SMA)
Half ATR Display: Shows 50% ATR value for quick stop-loss and take-profit calculations
Clean Value Table: Real-time values displayed on chart with configurable decimal precision
Flexible Settings: Customize length, smoothing method, and display options
Ideal for:
Setting dynamic stop losses and take profits
Position sizing based on current volatility
Comparing gap vs. no-gap volatility measurements
Trading instruments with large overnight gaps (indices, forex, crypto)
Use this indicator to get a more accurate picture of intraday volatility without the noise from session gaps!

Screener (SSA) [AlgoAlpha]🟠 OVERVIEW
This script is a multi-symbol screener that serves as a dashboard companion to the "Smart Signals Assistant (SSA)" indicator. Its purpose is to monitor the entire suite of SSA components—from the core signals to all confluence tools—across a customizable watchlist of up to 18 assets. By displaying the real-time status of each indicator in a single table, it allows traders to get a bird's-eye view of the market, quickly identify assets with strong trend confluence, and filter for high-probability setups without needing to switch charts.
The screener is designed to mirror the modularity of the main SSA indicator, allowing you to enable or disable components in the table to match your preferred trading dashboard.
🟠 CONCEPTS
The screener is built directly on the analytical framework of the Smart Signals Assistant, applying its complex, proprietary algorithms to each symbol in your watchlist and summarizing the results. The combination of these different analytical concepts is what gives the screener its utility, as it helps traders find opportunities where multiple, distinct strategies align.
Each column in the table represents a core trading concept:
Smart Signals: This is the primary signal engine, designed to identify potential entry points. It operates in different modes to capture both long-term swings and faster scalping opportunities.
Fair Value Trail (FVT): This component provides a dynamic, volatility-adjusted baseline for the trend. It acts as a form of dynamic support or resistance, helping to confirm the validity of a trend shown by the Smart Signals.
Trend Spine: This tool is designed to identify the underlying "backbone" of the market's trend. It filters out short-term price noise to provide a more stable, clear indication of the dominant market direction.
Trend Bias: This measures the strength and conviction behind a trend. It helps distinguish between a strong, accelerating move and a weak, decelerating one, adding a layer of momentum analysis.
Firmament Clouds: These are volatility-based bands that create dynamic overbought and oversold zones. They help identify when price is potentially overextended and due for a pullback or consolidation.
Trend-Range Classifier (TRC): A machine-learning model that analyzes market characteristics to classify the current environment as either "Trending" or "Ranging." This is crucial for helping traders apply the right strategy for the current conditions.
🟠 FEATURES
This screener organizes the complex data from the SSA indicator into a simple, color-coded table. Here is a breakdown of each column and its possible values:
Asset: Displays the ticker symbol for the asset being analyzed.
Smart Signals: Shows the latest signal from the core engine.
▲: A standard bullish signal has been detected.
▼: A standard bearish signal has been detected.
▲+: A strong bullish signal with higher conviction has been detected.
▼+: A strong bearish signal with higher conviction has been detected.
Fair Value Trail: Indicates the trend direction based on the volatility trail.
▲: The FVT is in a bullish trend (acting as dynamic support).
▼: The FVT is in a bearish trend (acting as dynamic resistance).
Trend Spine: Shows the direction of the core underlying trend.
▲: The underlying trend backbone is bullish.
▼: The underlying trend backbone is bearish.
Trend Bias: Measures the current momentum strength.
Strong▲: Strong and accelerating bullish momentum.
Weak▲: Bullish momentum exists but is weakening.
Strong▼: Strong and accelerating bearish momentum.
Weak▼: Bearish momentum exists but is weakening.
Firmament Clouds: Identifies overbought/oversold conditions relative to volatility.
Very Overbought / Overbought: Price is significantly extended above its recent range.
Very Oversold / Oversold: Price is significantly extended below its recent range.
Neutral: Price is trading within its normal volatility range.
Trend-Range Classifier: Displays the market state as determined by the ML model.
Trend: The market is in a trending environment, suitable for trend-following strategies.
Range: The market is in a ranging or consolidating environment, suitable for mean-reversion strategies.
Exit Signal Count: Tracks the number of take-profit signals that have occurred since the last primary Smart Signal.
0, 1, 2, 3...: A numerical count of exit signals. A higher number suggests a trend may be maturing or exhausting.
🟠 USAGE
The main purpose of the screener is to quickly identify assets where multiple components of the SSA system are in alignment, indicating a high-confluence trading opportunity.
1. Setup and Configuration:
Add the screener to your chart.
Go into the settings and populate the "Watchlist" group with the symbols you wish to monitor.
Ensure the settings for the components (Time Horizon, Signal Mode, etc.) are synchronized with the settings on your main SSA indicator for consistency.
2. Interpreting the Columns for Trading Decisions:
Start with the Big Picture (TRC): First, look at the "Trend-Range Classifier" column. If it shows "Trend," you should be looking for trend-following setups. If it shows "Range," you might avoid taking strong trend signals.
Establish Directional Bias (Spine & Bias): For trend-following, look for assets where the "Trend Spine" and "Trend Bias" agree. A "▲" in the Spine column combined with a "Strong▲" in the Bias column indicates a healthy and robust uptrend.
Time Your Entry (Smart Signals): Once you have an asset with a clear bias, watch the "Smart Signals" column for a fresh signal that aligns with that bias. A "▲+" signal appearing in an asset with a strong bullish bias across other columns is a high-confluence entry point.
Add Context (FVT & Clouds): Use the "Fair Value Trail" and "Firmament Clouds" to refine your entry. A buy signal is generally stronger if the FVT is also bullish ("▲") and the price is not in a "Very Overbought" state according to the clouds.
Manage the Trade (Exit Count): After entering a trade, keep an eye on the "Exit Signal Count." As the number increases, it serves as a warning that the trend is becoming extended and it might be time to take partial profits or tighten your stop-loss.
付费脚本

VWAP / MA + Average Candle Size [MaximizedTrading]VWAP / MA + Average Candle Size
Bring structure and precision to your trading with the VWAP / MA + Average Candle Size indicator, a comprehensive tool that combines every major Moving Average and VWAP variation in one adaptive system. Built for traders who want flexibility, accuracy, and a clear view of market volatility, this indicator gives you full control over your preferred averaging method and visualizes dynamic ACS-based bands that adjust automatically to changing conditions.
🧠 Why I Created This Indicator
Every trader has a favorite moving average or VWAP setup, but switching between them, recalibrating settings, and adding volatility bands can be a hassle. I built this indicator to unify all those features into a single, streamlined tool. Whether you’re a scalper using anchored VWAPs or a swing trader relying on EMAs, this indicator adapts to your workflow instantly.
I also integrated the Average Candle Size (ACS) concept to bring volatility into the equation. By combining VWAP or MA with ACS-based bands, you can instantly visualize how volatile the market is — and use those bands as dynamic zones for stop-loss or take-profit placement. This way, your strategy adapts naturally to real-time market conditions instead of relying on fixed levels.
🔧 Key Features:
All-in-One VWAP & MA Selection:
Choose between VWAP, SMA, EMA, SMMA (RMA), WMA, or VWMA — all within a single indicator.
Switch seamlessly without adding multiple tools to your chart.
Full VWAP Flexibility:
Customize your VWAP with adjustable anchor points such as Session, Week, Month, or Year — ideal for both intraday and swing trading setups.
Dynamic ACS Bands:
Up to three adaptive bands are automatically calculated based on the Average Candle Size.
Each band expands or contracts with volatility, allowing you to gauge market rhythm at a glance.
Stop-Loss & Take-Profit Guidance:
Use ACS bands as natural dynamic levels — a practical way to set stop-losses or take-profits that move with volatility rather than against it.
Visual Volatility Insights:
Quickly see when the market is quiet or active. During low volatility, the bands tighten; during strong movements, they widen — making volatility visually intuitive.
Clean and Minimal Layout:
Optimized for clarity and performance. All elements are easy to toggle on or off depending on your trading style.
📸 Example!
In this example, VWAP is anchored to the session while ACS bands (×1 and ×3) dynamically expand and contract with market volatility. Notice how price often finds resistance near the outer bands — a perfect visual guide for potential take-profit or re-entry zones.
In another setup, the 50 EMA serves as the main trend filter, with ACS bands framing price movement. During quiet periods, bands stay close to price, while during volatility spikes, they widen — clearly showing changing market conditions.
💬 I am dedicated to making this indicator as practical and user-friendly as possible. Feedback is always welcome — feel free to leave a comment or suggestion for future improvements!

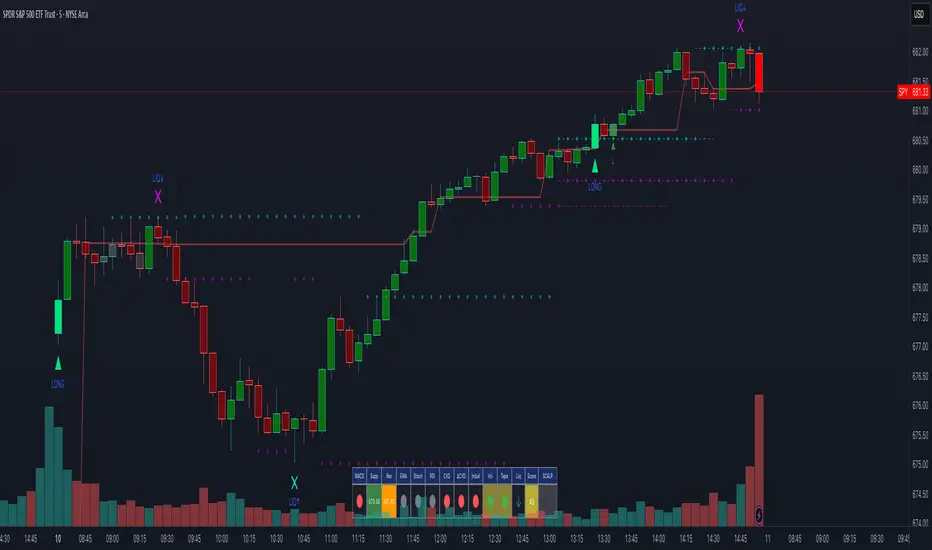
Scalping Dashboard - Volume Candles + Liquidity ZonesScalping Dashboard - Volume Candles + Liquidity Zones
📊 Overview
A comprehensive scalping indicator designed for high-frequency traders on 1-5 minute timeframes. This all-in-one dashboard combines volume analysis, order flow metrics, technical indicators, and institutional liquidity zones to identify high-probability scalping opportunities.
🎯 Key Features
✅ Multi-Timeframe Analysis
Fast MACD (5/13/5) for momentum
Quick EMAs (9/20/50) for trend direction
Rapid Stochastic (5/3/3) for oversold/overbought conditions
Fast RSI (7) for extreme readings
✅ Advanced Order Flow Metrics
CVD (Cumulative Volume Delta): Tracks buy vs sell pressure over time
Delta Momentum: Measures acceleration in buying/selling
Buy/Sell Pressure Ratio: Real-time balance of market forces
Order Flow Imbalance: Detects aggressive buying or selling
Tape Speed: Measures how fast volume is hitting the market
✅ Institutional Liquidity Zones
Buy-Side Liquidity: Areas above price where short stop losses cluster
Sell-Side Liquidity: Areas below price where long stop losses cluster
Liquidity Sweeps: Detects "stop hunts" by institutions before reversals
✅ Volume-Based Candle Coloring
Visual representation of volume intensity
Extreme, High, Normal, and Low volume categories
Fully customizable color schemes
✅ Dynamic Support/Resistance
Volume-weighted price levels
Automatically updates every 3 bars
Shows distance to key levels
📈 Dashboard Indicators Explained
The bottom-left dashboard displays 14 real-time metrics:
▸ MACD (●)
Green = Bullish momentum
Red = Bearish momentum
Gray = Neutral
▸ Supp (Price)
Support level
Green highlight = at support (good for long entry)
▸ Res (Price)
Resistance level
Orange highlight = at resistance (good for short entry)
▸ EMA (●)
Green = Price above EMAs (bullish)
Red = Price below EMAs (bearish)
▸ Stoch (●)
Green = Oversold (<20)
Red = Overbought (>80)
Gray = Neutral
▸ RSI (●)
Green = Oversold (<30)
Red = Overbought (>70)
Gray = Neutral
▸ CVD (●)
Green = Cumulative buying pressure
Red = Cumulative selling pressure
▸ ΔCVD (●)
Green = Increasing buy pressure
Red = Increasing sell pressure
▸ Imbal (●)
Green = Buy imbalance (>2:1 ratio)
Red = Sell imbalance
▸ Vol (●)
Green/Yellow background = Volume surge (>2x average)
▸ Tape (●)
Green/Yellow background = Fast tape (>1.5x speed)
▸ Liq (↑↓●)
↑ = Bullish sweep or near sell-side liquidity
↓ = Bearish sweep or near buy-side liquidity
● = Neutral
▸ Score (#L or #S)
Quality score (0-8) for Long or Short setups
Higher numbers = Better quality trade
▸ SCALP (LONG/SHORT/WAIT)
Primary signal
Bright color = High quality (score ≥5)
Dim color = Decent quality (score =4)
Gray = Wait for better setup
🎨 Candle Color System
Volume-Based Colors
Bright Green/Red: Extreme volume (>2.5x average) - Major moves
Medium Green/Red: High volume (>1.5x average) - Strong activity
Dull Green/Red: Normal volume - Standard market activity
Gray: Low volume (<0.5x average) - Avoid trading
Signal-Based Colors
Lime: Strong Long signal (score ≥5)
Green: Decent Long signal (score =4)
Orange: Strong Short signal (score ≥5)
Red: Decent Short signal (score =4)
Candle Color Modes (adjustable in settings):
Volume Only: Pure volume intensity
Volume + Signals: Signals override volume when present (default)
Signals Only: Only shows entry signals
🔵 Chart Indicators
Support & Resistance Lines
Green Line: Volume-weighted support level
Red Line: Volume-weighted resistance level
Lines update dynamically based on 100-bar volume profile
Liquidity Zones
Cyan Circles/Dashed Lines: Buy-side liquidity (above price)
Where short stop losses cluster
Potential targets for bullish moves
Institutions may push price here before reversing down
Magenta Circles/Dashed Lines: Sell-side liquidity (below price)
Where long stop losses cluster
Potential targets for bearish moves
Institutions may push price here before reversing up
Entry Markers
Large Green Triangle (▲): High quality long entry (score ≥5)
Small Green Triangle (▲): Decent long entry (score =4)
Large Orange Triangle (▼): High quality short entry (score ≥5)
Small Red Triangle (▼): Decent short entry (score =4)
Liquidity Sweep Markers
Cyan X-Cross (below bar): Bullish liquidity sweep - "LIQ↑"
Price swept sell-side liquidity and reversed up
Strong buy signal
Magenta X-Cross (above bar): Bearish liquidity sweep - "LIQ↓"
Price swept buy-side liquidity and reversed down
Strong sell signal
🎯 How to Use This Indicator
For Long Scalps (Buy):
Wait for Dashboard Signal: SCALP = "LONG" with score ≥5
Confirm Multiple Green Dots: Look for EMA, CVD, ΔCVD, Imbal all green
Check Volume: Vol or Tape should show yellow background (surge)
Look for Confluence:
Price at or near Support level (green highlight)
Price near Sell-Side Liquidity (magenta line below)
RSI oversold (green dot)
Large green triangle appears on chart
Best Entry: On a bullish liquidity sweep (cyan X-cross)
For Short Scalps (Sell):
Wait for Dashboard Signal: SCALP = "SHORT" with score ≥5
Confirm Multiple Red Dots: Look for EMA, CVD, ΔCVD, Imbal all red
Check Volume: Vol or Tape should show yellow background (surge)
Look for Confluence:
Price at or near Resistance level (orange highlight)
Price near Buy-Side Liquidity (cyan line above)
RSI overbought (red dot)
Large orange triangle appears on chart
Best Entry: On a bearish liquidity sweep (magenta X-cross)
Three Types of Scalping Setups:
1. Quick Scalp (Fastest - 1-5 minute holds)
MACD or Stochastic crossover + Volume surge
At Support/Resistance level
Score ≥4
2. Momentum Scalp (Ride the wave - 5-15 minute holds)
Strong EMA alignment + CVD slope positive
Order flow imbalance + Fast tape
Volume surge with price structure
Score ≥5
3. Reversal Scalp (Fade extremes - 3-10 minute holds)
Stochastic + RSI extreme readings
At Support/Resistance OR liquidity sweep
CVD momentum reversal
Score ≥6
⚙️ Recommended Settings
Timeframes
Primary: 1-minute, 2-minute, 5-minute
Confirmation: Use 15-minute chart for overall trend direction
Asset Types
Forex pairs (high liquidity)
Crypto (BTC, ETH with high volume)
Futures (ES, NQ)
Major stocks during market hours
Risk Management
Target: 1-3 times your stop loss
Stop Loss: Below nearest liquidity zone for longs, above for shorts
Position Size: Never risk more than 1% per trade
Score ≥5: Take full position size
Score =4: Take half position size or skip
🔧 Customization Options
Input Groups
MACD Settings
Fast Length: 5 (scalping optimized)
Slow Length: 13
Signal Length: 5
EMA Settings
EMA 9, 20, 50 (fast scalping EMAs)
Stochastic Settings
%K Length: 5
%D Smoothing: 3
Smooth: 3
CVD Settings
MA Length: 10 (for CVD smoothing)
RSI Settings
Length: 7 (fast RSI)
Overbought: 70
Oversold: 30
Volume Settings
MA Length: 10
Extreme Multiplier: 2.5x
High Multiplier: 1.5x
Low Multiplier: 0.5x
Liquidity Zone Settings
Lookback Periods: 20
Swing Strength: 3
Show Liquidity Zones: On/Off
Show Liquidity Sweeps: On/Off
Support/Resistance Settings
Volume Lookback: 100 bars (~2 hours on 1-min chart)
Order Flow Settings
Imbalance Threshold: 2.0 (2:1 ratio)
Color Customization
All volume colors customizable
All signal colors customizable
All liquidity colors customizable
📊 Volume Legend (Top Right)
The small table in the top-right corner shows the volume intensity key:
Extreme: >2.5x average volume
High: >1.5x average volume
Normal: 0.5x to 1.5x average volume
Low: <0.5x average volume
🔔 Built-in Alerts
Set up these alerts to never miss a trade:
High Quality Long Scalp: Triggers when entry_long and score ≥5
High Quality Short Scalp: Triggers when entry_short and score ≥5
Bullish Liquidity Sweep: Triggers when sell-side liquidity is swept
Bearish Liquidity Sweep: Triggers when buy-side liquidity is swept
To set up: Right-click chart → Add Alert → Select condition → Create
💡 Pro Tips
Understanding Liquidity Zones
Buy-Side Liquidity = Where shorts have their stops = Price tends to wick up here
Sell-Side Liquidity = Where longs have their stops = Price tends to wick down here
Liquidity Sweep = Institution triggers stops, absorbs liquidity, then reverses
Best trades = Enter AFTER the sweep when price reverses back
Reading the Dashboard
All Green Dots + Yellow Volume = Strong Long Setup
All Red Dots + Yellow Volume = Strong Short Setup
Mixed Colors = Choppy/Neutral = Wait
Score 6+ = Highest probability trades
Score 3 or less = Avoid
Confluence is Key
Never trade on a single indicator. Wait for:
Dashboard score ≥5
Volume surge (yellow background)
At support/resistance OR liquidity zone
CVD and momentum aligned
Price structure confirmation (triangle marker)
Avoid These Situations
❌ Low volume periods (gray candles)
❌ Dashboard shows "WAIT"
❌ Score below 4
❌ No volume surge during entry
❌ Trading against higher timeframe trend
Best Trading Sessions
Forex: London open (3-5 AM EST), NY open (8-10 AM EST)
Crypto: Works 24/7, best during high volume periods
Stocks: First hour (9:30-10:30 AM EST), last hour (3-4 PM EST)
Futures: US session open (9:30 AM EST)
🎓 Understanding the Scoring System
The indicator calculates a quality score (0-8) for both long and short setups:
+1 point for each:
EMA bias aligned (price above/below EMA structure)
CVD momentum bias aligned (buying/selling pressure)
Buy/Sell pressure ratio aligned (>1.5x or <0.67x)
Volume strength (surge detected)
Order flow imbalance (>2:1 ratio)
Tape speed (>1.3x average)
Price structure (higher highs or lower lows)
Liquidity bias (sweep detected)
Score Interpretation:
7-8: Extremely high probability (rare, take immediately)
6: Very high probability (excellent trade)
5: High probability (good trade)
4: Decent probability (acceptable with tight stop)
3 or less: Low probability (wait for better setup)
📋 Quick Reference Card
Entry Checklist
Dashboard shows LONG or SHORT
Score is ≥5
Multiple indicators aligned (green or red dots)
Volume surge present (yellow background)
At support/resistance or liquidity zone
Triangle marker appeared on chart
Risk:Reward ratio is at least 1:2
Exit Strategy
Take Profit: At opposite liquidity zone or resistance/support
Stop Loss: Below sell-side liquidity (longs) or above buy-side liquidity (shorts)
Trail Stop: Move to breakeven after 1:1 risk:reward achieved
⚠️ Important Notes
This is NOT a holy grail: No indicator is 100% accurate. Always use proper risk management.
Backtest first: Paper trade or backtest on your specific instrument before using real money.
Market conditions matter: This indicator works best in trending or volatile markets, not in tight consolidation.
Combine with price action: Use the indicator as confluence with your own price action reading.
Adjust for your instrument: Different assets may require tweaking the sensitivity settings.
Lower timeframes = More noise: 1-minute charts have more false signals than 5-minute charts.
🔄 Version History
v1.0 - Initial release
Multi-indicator dashboard
Volume-based candle coloring
Support/Resistance detection
Entry signal generation
v2.0 - Current version
Added liquidity zone detection
Added liquidity sweep identification
Enhanced scoring system (now 0-8)
Added liquidity bias to entries
New alerts for liquidity sweeps
Improved dashboard with Liq indicator
📞 Support & Feedback
If you find this indicator helpful, please:
⭐ Give it a boost
💬 Share your results in the comments
🐛 Report any bugs or issues
💡 Suggest improvements
Disclaimer: This indicator is for educational purposes only. Trading involves significant risk. Past performance does not guarantee future results. Always trade responsibly and never risk more than you can afford to lose.
🏆 Credits
Created for serious scalpers who want institutional-level insights on retail charts. Combines order flow analysis, volume profiling, and liquidity mapping into one comprehensive tool.
Happy Scalping! 🚀📈
MACD Volume VWAP Scalping (2min) by Obiii📘 Strategy Description (for TradingView)
MACD Volume VWAP Scalping Strategy (2-Minute Intraday Momentum)
This strategy is designed for scalpers and short-term intraday traders who focus on capturing small, high-probability moves during the most active hours of the trading session — typically between 9:45 AM and 11:30 AM (New York time).
The system combines three key momentum confirmations:
MACD crossovers to detect short-term trend shifts,
Volume spikes to validate real market participation, and
VWAP / EMA alignment to filter trades in the direction of the prevailing intraday trend.
🔹 Entry Logic
Long Entry:
MACD line crosses above the signal line
Both MACD and Signal are above zero
Current volume > average of the last 10 candles
Price is above VWAP and (optionally) above EMA 9 and EMA 20
Short Entry:
MACD line crosses below the signal line
Both MACD and Signal are below zero
Current volume > average of the last 10 candles
Price is below VWAP and (optionally) below EMA 9 and EMA 20
🎯 Exit Logic
Fixed Take Profit: +0.25%
Fixed Stop Loss: -0.15% to -0.20%
Optionally, switch to the 5-minute chart after entry to monitor momentum and manage exits more smoothly.
⚙️ Recommended Settings
Timeframe: 2 minutes (entries), 5 minutes (monitoring)
Market Session: 9:45 AM – 11:30 AM EST
Assets: Highly liquid instruments such as SPY, QQQ, NVDA, TSLA, AAPL, or large-cap momentum stocks.
💡 Notes
This is a momentum-based scalping strategy — precision and discipline are key.
It performs best in high-volume environments where clear direction emerges after the morning volatility settles.
The system can be fine-tuned for different profit targets, MACD settings, or volume thresholds depending on volatility.

Pearson SL/TP📘 Description
Pearson SL/TP — Advanced Correlation-Based Strategy with Full Risk Management
The Pearson SL/TP indicator is an advanced market analysis tool that combines Pearson correlation, volatility-based stop/target levels, and dynamic signal strength evaluation.
It is designed for traders who want to visualize potential momentum shifts and risk/reward zones in a single, integrated chart.
🔍 Core Concept
This script measures the **Pearson correlation coefficient between recent price movements and time progression, highlighting potential trend exhaustion or momentum reversals when the correlation reaches extreme values.
* High positive correlation (near +1) → price moving steadily upward → possible overbought condition.
* High negative correlation (near -1) → price moving steadily downward → possible oversold condition.
When these extremes are reached, and confirmed by several internal filters, the script generates LONG or SHORT signals with fully calculated Stop Loss and Take Profit levels.
⚙️ Main Features
📈 Signal Generation
* Uses Pearson correlation as a primary indicator of trend intensity.
* Detects potential reversal zones when correlation crosses user-defined thresholds.
* Optional divergence confirmation enhances signal reliability.
💰 Risk Management
* Stop Loss (SL) and Take Profits (TP1 & TP2) automatically adapt to volatility using the ATR (Average True Range).
* Dynamic risk/reward ratios help assess trade quality.
* Adjustable multipliers let you fine-tune your risk parameters.
🧠 Signal Strength Analysis
Each signal is graded from Weak to Very Strong based on four factors:
1. Volume activity
2. Trend alignment
3. Pearson momentum
4. Correlation change intensity
🎨 Visualization
* Overbought / Oversold background zones
* Signal arrows (LONG / SHORT)
* SL / TP** price levels and labels
* Interactive dashboard** displaying:
* Current Pearson value
* Market state (Overbought / Oversold / Neutral)
* Signal strength
* Latest trade data (Entry, SL, TP1, TP2, Risk:Reward)
🔔 Alerts
Built-in alerts for:
* Confirmed LONG / SHORT signals
* Bullish / Bearish divergences
🧩 Customization
All major parameters — including **Pearson length, thresholds, ATR multipliers, and visual options — are fully customizable.
This allows you to adapt the indicator to any market, timeframe, or trading style.

Victoria RSI Hybrid Pro – Momentum + Volume + DivergenceConditions and Actions:
RSI > 50 → Bullish regime → Consider Calls
RSI < 50 → Bearish regime → Consider Puts
RSI crosses up → Momentum shift up → Buy confirmation
RSI crosses down → Momentum shift down → Sell confirmation
RSI > 70 → Overbought → Take profits
RSI < 30 → Oversold → Watch for reversal
Bullish divergence → Hidden upward momentum → Reversal watch
Bearish divergence → Hidden downward momentum → Reversal watch
4. Multi-Indicator Confirmation Rules
Combine signals from EMA, SMA, RSI, and Volume to identify high-confidence trades.
Rules:
Triple Green → EMA1>SMA3, RSI>50, Volume Up → Buy Calls / Shares
Triple Red → EMA1 70 + Weak Volume → Exit Calls early
EMA1 flips direction + Strong Volume → Confirm bias immediately
RSI on 1H agrees with main chart → Trend continuation likely
6. Timeframes
Scalps: 1m–5m
Next-Day Options: 15m–1H
Swings: 4H–1D
7. Key Mindset Rules
Patience beats prediction. Wait for confirmations.
Volume confirms conviction, not direction.
If RSI and Overlay disagree → No trade.
Only act when 2 of 3 systems (EMA, RSI, Volume) align.

Momentum Pulse Strategy v1How does this strategy work
1. It analyses current market condition based on moving averages and determines Bullish or Bearish market condition
2. Once we confirm the current market condition, we look for a specific type of candle that has taken the liquidity which is the C1 candle marked on chart
3. Next we look for failure of that liquidity and a candle that engulfs it which confirms the trade and automatically shows the entry,sl and take profits
4. We always enter on the next candle after confirmation which is confirmed by an arrow
Guide
Alerts for Bullish/Bearish market conditions, C1 and confirmation candle available
Master alert for All the conditions also available. On and off also available for all the alert types
All the visuals are customisable in settings
Customisable take profit levels
Entry is the Gold line. SL is the red line and green lines are the Tps
Backtest the trades given by the indicator and to know the max drawdown based on the asset and timeframe
For any other info contact me on tradingview

coinbot_ICT_Unicorn(AUTOTRADE)1. 🎯 핵심 기능: 자동매매 신호 전송 (Webhook)
이 스크립트는 매매 신호가 발생할 때마다, 사용자가 '자동매매 설정(Autotrade Settings)'에 입력한 값들을 조합하여 구체적인 JSON 메시지를 생성하고 alert() 함수를 통해 웹훅으로 전송합니다.
입력 설정: user_id, exchange(거래소), leverage(레버리지), capital_percent(투입 시드 %), sl_percent(손절 %), 그리고 3단계 분할 익절(tp1_price_percent, tp1_qty_percent 등) 설정을 입력받습니다.
신호 종류:
ENTRY (진입): 매수(buy) 또는 매도(sell) 신호가 발생하면, 위 모든 설정값을 포함한 진입 명령을 보냅니다.
CLOSE (손절): 전략의 내부 로직에 의해 손절가에 도달하면(slAlertTick), 포지션을 종료하라는 신호를 보냅니다.
TAKE_PROFIT (익절): 목표가에 도달하면(tpAlertTick), 설정된 물량만큼 익절하라는 신호를 보냅니다.
2. 📈 작동 원리: "ICT 유니콘" 매매 전략
이 스크립트의 진입 로직은 ICT(Inner Circle Trader) 개념 중 하나인 **'유니콘 모델'**을 따릅니다.
구성 요소 식별:
Breaker Block (BB): '브레이커 블록'을 식별합니다. 이는 특정 고점/저점을 만든 후 그 방향으로 가지 못하고 반대 방향으로 돌파(Break)된 오더 블록(Order Block)입니다.
Fair Value Gap (FVG): '공정 가치 갭' (가격 불균형 영역)을 식별합니다.
핵심 진입 신호 (Unicorn): 이 전략의 핵심 진입 조건은 **Breaker Block(BB)과 Fair Value Gap(FVG)이 중첩(Overlap)**되는, 소위 '유니콘'이라 불리는 강력한 지지/저항 영역이 발생하는 것입니다.
Long (매수) 진입:
가격이 하락하며 **'하락형 브레이커 블록(Bearish Breaker Block)'**을 만듭니다.
이후 가격이 상승 돌파하며 이 브레이커 블록 영역과 중첩되는 **'상승형 FVG(Bullish FVG)'**를 생성합니다.
이 중첩 영역(FVG-BB Overlap)이 바로 매수 진입의 근거가 됩니다. (코드가 dbgRequireRetracement 설정에 따라 FVG로의 되돌림을 기다리거나 즉시 진입 신호를 보냅니다.)
Short (매도) 진입:
가격이 상승하며 **'상승형 브레이커 블록(Bullish Breaker Block)'**을 만듭니다.
이후 가격이 하락 돌파하며 이 브레이커 블록 영역과 중첩되는 **'하락형 FVG(Bearish FVG)'**를 생성합니다.
이 중첩 영역이 매도 진입의 근거가 됩니다.
3. 📊 부가 기능
시각화: 차트 상에 FVG 영역과 Breaker Block 영역을 박스로 그려주어(설정에 따라 표시/숨김 가능) 매매 근거를 시각적으로 확인할 수 있게 합니다.
백테스팅 대시보드: 차트 우측 상단(기본값)에 이 전략의 누적 성과(총 진입 횟수, 승/패, 승률, 총수익률)를 보여주는 대시보드를 표시합니다.
요약
이 스크립트는 **"Breaker Block과 FVG의 중첩(유니콘 모델)"**을 유일한 진입 조건으로 사용하는 매우 구체적인 ICT 전략입니다. 이 조건이 충족되면, 사용자가 미리 설정한 상세한 리스크 관리 값들을 담아 자동매매 봇으로 즉시 실행 가능한 주문 신호를 전송하는 '올인원(All-in-One)' 전략 스크립트입니다.
요청하신 대로, 해당 지표 요약본을 영어로 번역하여 제공합니다.
This script is an automated trading (Autotrade) strategy signal generator based on the ICT "Unicorn" trading model.
As the "AUTOTRADE" in its name implies, the core purpose of this indicator is to detect specific conditions on the chart and send JSON-formatted order signals (webhooks) to an external automated trading bot.
Here are the core mechanics and features of this script:
1. 🎯 Core Feature: Automated Signal Transmission (Webhook)
Whenever a trade signal occurs, this script generates a specific JSON message by combining the values entered by the user in the "Autotrade Settings" and sends it via webhook using the alert() function.
Input Settings: It takes inputs for user_id, exchange, leverage, capital_percent (equity %), sl_percent (stop loss %), and settings for 3-stage split take-profits (e.g., tp1_price_percent, tp1_qty_percent).
Signal Types:
ENTRY: When a "buy" or "sell" signal occurs, it sends an entry command including all the settings above.
CLOSE (Stop-Loss): If the price hits the stop loss according to the strategy's internal logic (slAlertTick), it sends a signal to close the position.
TAKE_PROFIT: When a profit target is reached (tpAlertTick), it sends a signal to take profit on the specified quantity.
2. 📈 How It Works: The "ICT Unicorn" Strategy
The script's entry logic follows the "Unicorn Model," one of the concepts from ICT (Inner Circle Trader).
Identifying Components:
Breaker Block (BB): It identifies a "Breaker Block." This is an Order Block that, after creating a specific high/low, fails to continue in that direction and is instead broken through in the opposite direction.
Fair Value Gap (FVG): It identifies a "Fair Value Gap" (a price imbalance area).
Core Entry Signal (The Unicorn): The core entry condition for this strategy is the overlap of a Breaker Block (BB) and a Fair Value Gap (FVG), which creates a powerful support/resistance zone known as the "Unicorn."
Long Entry:
Price moves down, creating a "Bearish Breaker Block."
Subsequently, price breaks upward, creating a "Bullish FVG" that overlaps with this Breaker Block area.
This overlapping area (FVG-BB Overlap) becomes the basis for the long entry. (Depending on the dbgRequireRetracement setting, the code either waits for a retracement to the FVG or sends an immediate entry signal.)
Short Entry:
Price moves up, creating a "Bullish Breaker Block."
Subsequently, price breaks downward, creating a "Bearish FVG" that overlaps with this Breaker Block area.
This overlapping area becomes the basis for the short entry.
3. 📊 Additional Features
Visualization: It draws the FVG and Breaker Block zones as boxes on the chart (can be toggled in settings), allowing for visual confirmation of the trade setup.
Backtesting Dashboard: It displays a dashboard in the top-right corner (by default) showing the strategy's cumulative performance (total entries, wins/losses, win rate, total profit).
Summary
This script is a highly specific ICT strategy that uses the "overlap of a Breaker Block and an FVG (the Unicorn Model)" as its sole entry condition. When this condition is met, it transmits an immediately executable order signal to an automated trading bot, complete with all the detailed risk management values preset by the user. It is an "all-in-one" strategy script.

AI Scalping Signals# 🤖 AI-Powered Scalping Indicator - Ultra-Fast Trading Signals
## Overview
This advanced AI-driven **scalping indicator** is specifically engineered for high-frequency traders operating on smaller timeframes. Designed exclusively for **1-minute, 3-minute, and 5-minute charts**, this system combines multiple sophisticated technical analysis methods to identify rapid-fire, high-probability trade entries and exits. The AI algorithms analyze market momentum, micro-trend strength, and instant price dynamics in real-time, delivering lightning-fast BUY and SELL signals perfect for scalping strategies.
## Key Features
### ✨ AI-Enhanced Scalping Signal Generation
- **Machine Learning Integration**: Proprietary AI algorithms process multiple technical indicators simultaneously with millisecond precision to catch quick market moves
- **Smart Cross-Validation**: The AI system validates signals across multiple micro-conditions before generating alerts, perfect for fast-paced scalping
- **Adaptive Micro-Trend Analysis**: Intelligent momentum and trend detection optimized specifically for 1M, 3M, and 5M timeframes
- **Low-Latency Processing**: Designed for speed—signals generate instantly when conditions align for rapid trade execution
### 📊 Clean Visual Interface for Fast Trading
- **Crystal Clear Signals**: Easy-to-read BUY (green) and SELL (red) labels appear directly on your chart—no delay, no confusion
- **Background Confirmation**: Subtle background highlighting provides additional visual confirmation of scalping signals
- **No Chart Clutter**: The indicator focuses on signals only—no unnecessary lines or plots to distract from rapid price action and quick decision-making
- **Optimized for Speed**: Minimalist design allows you to spot and execute trades in seconds
### 🔔 Comprehensive Alert System for Scalpers
- **Real-Time Notifications**: Get instantly notified when AI-confirmed BUY or SELL signals are generated—critical for scalping success
- **Multi-Alert Options**: Separate alerts for buy signals, sell signals, or combined alerts for any scalping opportunity
- **Never Miss a Quick Move**: Set up alerts and let the AI monitor rapid market movements 24/7
- **Mobile-Friendly**: Receive alerts on your phone for on-the-go scalping
## How It Works
The indicator employs a sophisticated multi-layer analysis system optimized for scalping:
1. **Micro-Trend Analysis Layer**: AI algorithms analyze rapid trend shifts using advanced moving average techniques calibrated for small timeframes
2. **Momentum Spike Detection**: Smart momentum oscillators identify instant overbought and oversold conditions with scalping-level precision
3. **Price Action Validation**: Proprietary price cross-detection ensures signals align with actual market microstructure movements
4. **AI Flash Confirmation**: All conditions are processed through ultra-fast AI validation logic for immediate signal generation
### Signal Conditions
**🟢 BUY Signal (Long Scalp Entry)**
Generated when the AI system confirms:
- Bullish micro-trend alignment detected
- Price momentum shows instant strength above key thresholds
- AI-validated upward price breakout occurs on small timeframe
- Multiple technical confirmations align simultaneously for quick profit potential
**🔴 SELL Signal (Short Scalp Entry)**
Generated when the AI system confirms:
- Bearish micro-trend alignment detected
- Price momentum shows instant weakness below key thresholds
- AI-validated downward price breakdown occurs on small timeframe
- Multiple technical confirmations align simultaneously for quick profit potential
## Best Practices for Scalping
### Recommended Usage
- **⚡ Optimal Timeframes**: Specifically calibrated for **1-minute, 3-minute, and 5-minute charts** for maximum scalping performance
- **Markets**: Highly effective on forex pairs (especially majors), crypto (BTC, ETH), and high-liquidity stocks and indices
- **Session Focus**: Best results during high-volume trading sessions (London/NY overlap for forex, market open for stocks)
- **Quick Execution**: This is a scalping tool—execute trades immediately when signals appear
- **Risk Management**: Use tight stop-losses (5-15 pips for forex) and quick take-profits; scalping requires strict risk control
### Scalping Strategy Tips
- Execute trades instantly—scalping requires fast action within seconds of signal generation
- Use 1:1 or 1:2 risk-reward ratios for consistent scalping profits
- Monitor spreads and commissions—they matter significantly for scalpers
- Trade during high liquidity hours to ensure tight spreads and quick fills
- Consider trading multiple signals per session for accumulated gains
- Set mobile alerts to catch quick opportunities throughout the day
- Close positions quickly—don't let scalps turn into swing trades
- The background color change provides a split-second early warning system
## What Makes This Scalping Indicator Different?
Unlike traditional indicators designed for longer timeframes, this AI-powered scalping tool:
- ✅ **Built Exclusively for Scalping**: Optimized specifically for 1M, 3M, and 5M timeframes—not a generic indicator
- ✅ Combines multiple technical analysis methods with millisecond-precision AI processing
- ✅ Uses artificial intelligence to filter noise and validate only the fastest, cleanest scalping signals
- ✅ Eliminates the need to manually analyze multiple indicators during rapid market moves
- ✅ Provides clear, actionable signals with no interpretation required—critical for scalping speed
- ✅ Reduces false signals through multi-condition validation tuned for small timeframes
- ✅ Adapts to rapid volatility changes and micro-trend shifts in real-time
- ✅ Zero lag—signals appear instantly when conditions align for immediate execution
## Important Disclaimers
⚠️ **Scalping Risk Warning**: Scalping involves extremely high frequency trading with substantial risk of loss. This indicator is a tool to assist with fast-paced analysis and should not be the sole basis for trading decisions. Scalping requires experience, discipline, and proper risk management.
⚠️ **No Guarantee**: Past performance and backtested results do not guarantee future performance. No indicator is 100% accurate, especially in volatile scalping conditions.
⚠️ **Due Diligence**: Always conduct your own research and analysis. Use proper risk management with every single trade. Never risk more than 1-2% of your account per scalp trade.
⚠️ **Transaction Costs**: Be aware that scalping involves frequent trading, which means higher commission and spread costs. Ensure your broker offers competitive pricing for high-frequency trading.
⚠️ **Educational Tool**: This indicator is designed as an educational and analytical tool for experienced traders. Users are solely responsible for their own trading decisions.
## Settings & Customization
This is a **protected scalping indicator** with optimized parameters locked specifically for 1-minute, 3-minute, and 5-minute chart performance. The AI algorithms have been fine-tuned through extensive backtesting and live scalping optimization. No manual adjustments are needed—simply add to your small timeframe chart and start receiving rapid-fire signals.
## Support & Updates
This indicator receives regular updates to enhance AI algorithms and improve signal accuracy. For questions or support, please contact the publisher.
---
**Ready to dominate the scalping game with AI-powered lightning-fast signals?** Add this indicator to your 1M, 3M, or 5M chart and experience the difference of intelligent, validated scalping signals designed for rapid-fire trading.
*Remember: Scalping success requires lightning-fast execution, strict discipline, proper risk management, and continuous practice. Use this tool as part of a comprehensive scalping strategy with tight stop-losses and realistic profit targets.*

[Kpt-Ahab] Assistant: Risk & DCA PlannerScript Description – Assistant: Risk & DCA Planner
The Risk & DCA Planner is a technical assistant for position and risk management.
It automatically calculates, based on volatility (ATR%), swing structure, and your settings:
Stop-Loss (SL) and corresponding Take-Profit targets (TPs) in R-multiples
DCA (Dollar-Cost-Averaging) levels — both price and amount
A market suitability check (based on volatility & volume)
Plus a clear table and summary label displayed on the chart
The script helps you plan risk, scaling, and profit targets consistently and quantitatively.
Core Logic
Risk Profile
Three modes: Low, Normal, High.
These define how reactive the script behaves internally:
Low → conservative, longer lookbacks, tighter analysis
Normal → balanced
High → aggressive, faster reaction, wider stops
Stop-Loss (SL)
Automatically calculated from ATR% and recent swing structure, limited by minimum and maximum thresholds.
The SL percentage defines the R-unit, which all TPs and DCA levels are based on.
Take-Profits (TPs)
Up to six targets, each a multiple of the defined risk (e.g., 1R, 2R, 3R).
Prices are automatically adjusted depending on long or short direction.
DCA Strategy
Optional. Adds scaling levels evenly between Entry and SL or in multiples of the ATR.
Each DCA allocation grows geometrically until the maximum position size is reached.
Suitability Check
Evaluates whether the market is within an appropriate ATR% range and has sufficient volume.
The table displays “OK” or “Caution” depending on volatility and historical consistency.
Visualization
Lines for SL, TPs, and DCA levels
A table with all parameters, prices, and risk data
A chart label summarizing key info (profile, direction, SL%, TPs, DCA, etc.)

Advanced Multi-Timeframe Trend & Signal System═══════════════════════════════════════════════════════════════
ADVANCED MULTI-TIMEFRAME TREND & SIGNAL SYSTEM v1.0
═══════════════════════════════════════════════════════════════
Created by: Zakaria Safri
License: Mozilla Public License 2.0
A comprehensive technical analysis tool designed for traders seeking
multi-dimensional market insights. This indicator combines proven
technical analysis methods with modern visualization techniques.
═══════════════════════════════════════════════════════════════
KEY FEATURES
═══════════════════════════════════════════════════════════════
✓ SUPERTREND SIGNAL GENERATION
- Customizable sensitivity settings
- Clear long/short entry signals
- Automatic trend direction detection
- ATR-based dynamic calculations
✓ MULTI-TIMEFRAME DASHBOARD
- Real-time trend analysis across 6 timeframes
- Synchronized trend confirmation
- Customizable table position and size
- Current: 1M, 5M, 15M, 1H, 1D coverage
✓ QQE REVERSAL DETECTION
- Quantitative Qualitative Estimation algorithm
- Early reversal signal identification
- Adjustable RSI and smoothing parameters
- Confirmation-based plotting
✓ DYNAMIC SUPPORT & RESISTANCE
- Pivot-based level calculation
- Quick and standard pivot detection
- Color-coded zones (8 levels)
- Automatic level updates
✓ MOMENTUM BREAKOUT SIGNALS
- Ichimoku-inspired calculations
- Bullish and bearish breakout detection
- Visual zone highlighting
- Trend confirmation filters
✓ RISK MANAGEMENT SYSTEM
- ATR-based stop loss calculation
- Multiple take profit targets (TP1, TP2, TP3)
- Customizable risk-to-reward ratios
- Dynamic price level tracking
- Hit detection markers
✓ VOLATILITY BANDS
- Keltner Channel implementation
- Multiple band layers (3 levels)
- EMA-based calculations
- Adaptive to market conditions
✓ TREND CLOUD VISUALIZATION
- Dual moving average cloud
- Clear trend direction indication
- Customizable color scheme
- Trend bar coloring
═══════════════════════════════════════════════════════════════
HOW TO USE
═══════════════════════════════════════════════════════════════
SETUP:
1. Add indicator to your chart
2. Configure sensitivity in Core Signals section
3. Enable desired features (signals, reversals, breakouts)
4. Set up risk management levels if trading
5. Position MTF dashboard to preference
SIGNAL INTERPRETATION:
• LONG Signal: Price crosses above Supertrend
• SHORT Signal: Price crosses below Supertrend
• REV (Reversal): QQE indicates potential trend change
• Diamond Breakouts: Momentum shift confirmation
• T1/T2/T3: Take profit level hits
MULTI-TIMEFRAME ANALYSIS:
• Green (BULL): Higher timeframe supports uptrend
• Red (BEAR): Higher timeframe supports downtrend
• Use for trend alignment and confirmation
• Best results when multiple timeframes align
RISK MANAGEMENT:
• Enable Stop Loss for automatic SL calculation
• Activate TP levels based on trading style
• Adjust Risk-to-Reward ratio (1:1 to 1:10)
• Monitor hit detection circles for exits
═══════════════════════════════════════════════════════════════
TECHNICAL SPECIFICATIONS
═══════════════════════════════════════════════════════════════
CALCULATIONS:
• Supertrend: ATR-based with customizable multiplier
• QQE: Modified RSI with Wilders smoothing
• Keltner Channels: EMA basis with ATR bands
• Pivots: Standard left/right bar methodology
• Support/Resistance: Multi-level pivot analysis
PARAMETERS:
• Supertrend Sensitivity: 0.5 to 10.0 (default: 2.0)
• RSI Period: 5 to 50 (default: 14)
• QQE Multiplier: 1.0 to 10.0 (default: 4.238)
• Risk-to-Reward: 1 to 10 (default: 4)
TIMEFRAMES:
Compatible with all timeframes. MTF dashboard displays:
• 1 Minute (1M)
• 5 Minutes (5M)
• 15 Minutes (15M)
• 1 Hour (1H)
• 1 Day (1D)
• Current chart timeframe
═══════════════════════════════════════════════════════════════
CUSTOMIZATION OPTIONS
═══════════════════════════════════════════════════════════════
VISUAL:
• Professional color scheme (Cyan/Orange)
• Adjustable table position (9 positions)
• Table size options (tiny/small/normal/large)
• Transparent zone highlighting
• Clean, modern label design
TOGGLES:
• Enable/disable any feature independently
• Show/hide signals, reversals, breakouts
• Toggle S/R levels and zones
• Control trend cloud and bands
• Master trend line optional
ALERTS:
The indicator provides visual signals that can be used with
TradingView's alert system by setting alerts on the indicator.
═══════════════════════════════════════════════════════════════
BEST PRACTICES
═══════════════════════════════════════════════════════════════
✓ Combine signals for higher probability setups
✓ Use MTF dashboard for trend confirmation
✓ Respect S/R levels for entry/exit planning
✓ Monitor QQE reversals at key price levels
✓ Adjust sensitivity based on asset volatility
✓ Test on demo/paper trading first
✓ Use proper risk management always
═══════════════════════════════════════════════════════════════
IMPORTANT DISCLAIMER
═══════════════════════════════════════════════════════════════
This indicator is a technical analysis tool and does NOT:
• Guarantee profitable trades
• Provide financial advice
• Predict future price movements with certainty
• Replace proper risk management
• Substitute for personal due diligence
Past performance does not indicate future results. All trading
involves risk. Users should:
- Understand the indicator's logic
- Test thoroughly before live trading
- Use appropriate position sizing
- Never risk more than they can afford to lose
- Consult financial advisors if needed
═══════════════════════════════════════════════════════════════
CODING STANDARDS
═══════════════════════════════════════════════════════════════
This indicator follows PineCoders Coding Conventions:
✓ Proper variable naming (prefixes: i_, f_, c_)
✓ Clear function documentation
✓ Organized code structure
✓ Type declarations
✓ Efficient calculations
✓ No repainting (confirmed signals)
✓ Proper use of request.security
═══════════════════════════════════════════════════════════════
SUPPORT & UPDATES
═══════════════════════════════════════════════════════════════
Version: 1.0
Author: Zakaria Safri
License: MPL 2.0
Last Updated: 2024
For questions, feedback, or suggestions, please comment below.
═══════════════════════════════════════════════════════════════
#trading #signals #supertrend #multiTimeframe #QQE #reversals
#supportResistance #riskManagement #trendAnalysis #momentum

Multi-Timeframe EMA Trend Dashboard with Volume and RSI Filters═══════════════════════════════════════════════════════════
MULTI-TIMEFRAME EMA TREND DASHBOARD
═══════════════════════════════════════════════════════════
OVERVIEW
This indicator provides a comprehensive view of trend direction across multiple timeframes using the classic EMA 20/50 crossover methodology, enhanced with volume confirmation and RSI filtering. It aggregates trend information from six timeframes into a single dashboard for efficient market analysis.
The indicator is designed for educational purposes and to assist traders in identifying potential trend alignments across different time horizons.
═══════════════════════════════════════════════════════════
FEATURES
═══════════════════════════════════════════════════════════
MULTI-TIMEFRAME ANALYSIS
• Monitors 6 timeframes simultaneously: 1m, 5m, 15m, 1H, 4H, 1D
• Each timeframe analyzed independently using request.security()
• Non-repainting implementation with proper lookahead settings
• Calculates overall trend strength as percentage of bullish timeframes
EMA CROSSOVER SYSTEM
• Fast EMA (default: 20) and Slow EMA (default: 50)
• Bullish: Fast EMA > Slow EMA
• Bearish: Fast EMA < Slow EMA
• Neutral: Fast EMA = Slow EMA (rare condition)
• Visual EMA plots with optional fill area
VOLUME CONFIRMATION
• Optional volume filter for crossover signals
• Compares current volume against moving average (default: 20-period SMA)
• Categorizes volume as: High (>1.5x average), Normal (>average), Low (70), oversold (<30), and neutral zones
• Used in quality score calculation
• Optional display toggle
SUPPORT & RESISTANCE DETECTION
• Automatic detection using highest/lowest over lookback period (default: 50 bars)
• Plots resistance (red), support (green), and mid-level (gray)
• Step-line style for clear visualization
• Optional display toggle
QUALITY SCORING SYSTEM
• Rates trade setups from 1-5 stars
• Considers: MTF alignment, volume confirmation, RSI positioning
• 5 stars: 4+ timeframes aligned + volume confirmed + RSI 50-70
• 4 stars: 4+ timeframes aligned + volume confirmed
• 3 stars: 3+ timeframes aligned
• 2 stars: Exactly 3 timeframes aligned
• 1 star: Other conditions
VISUAL DASHBOARD
• Clean table display (position customizable)
• Color-coded trend indicators (green/red/yellow)
• Extended statistics panel (toggleable)
• Shows: Trends, Strength, Quality, RSI, Volume, Price Distance
═══════════════════════════════════════════════════════════
TECHNICAL SPECIFICATIONS
═══════════════════════════════════════════════════════════
CALCULATIONS
Trend Determination per Timeframe:
• request.security() fetches EMA values with gaps=off, lookahead=off
• Compares Fast EMA vs Slow EMA
• Returns: 1 (bullish), -1 (bearish), 0 (neutral)
Trend Strength:
• Counts number of bullish timeframes
• Formula: (bullish_count / 6) × 100
• Range: 0% (all bearish) to 100% (all bullish)
Price Distance from EMA:
• Formula: ((close - EMA) / EMA) × 100
• Positive: Price above EMA
• Negative: Price below EMA
• Warning when absolute distance > 5%
ANTI-REPAINTING MEASURES
• All request.security() calls use lookahead=barmerge.lookahead_off
• Dashboard updates only on barstate.islast
• Historical bars remain unchanged
• Crossover signals finalize on bar close
═══════════════════════════════════════════════════════════
USAGE GUIDE
═══════════════════════════════════════════════════════════
INTERPRETING THE DASHBOARD
Timeframe Rows:
• Each row shows individual timeframe trend status
• Look for alignment (multiple timeframes same direction)
• Higher timeframes generally more significant
Strength Indicator:
• >66.67%: Strong bullish (4+ timeframes bullish)
• 33.33-66.67%: Mixed/choppy conditions
• <33.33%: Strong bearish (4+ timeframes bearish)
Quality Score:
• Higher stars = better confluence of factors
• 5-star setups have strongest multi-factor confirmation
• Lower scores may indicate weaker or conflicting signals
SUGGESTED APPLICATIONS
Trend Confirmation:
• Check if multiple timeframes confirm current chart trend
• Higher agreement = stronger trend confidence
• Use for position sizing decisions
Entry Timing:
• Wait for EMA crossover on chart timeframe
• Confirm with higher timeframe alignment
• Volume above average preferred
• RSI not in extreme zones
Divergence Detection:
• When lower timeframes diverge from higher
• May indicate trend exhaustion or reversal
• Requires additional confirmation
CUSTOMIZATION
EMA Settings:
• Adjust Fast/Slow lengths for different sensitivities
• Shorter periods = more responsive, more signals
• Longer periods = smoother, fewer signals
• Common alternatives: 10/30, 12/26, 50/200
Volume Filter:
• Enable for higher-quality signals (fewer false positives)
• Disable in always-liquid markets or for more signals
• Adjust MA length based on typical volume patterns
Display Options:
• Toggle EMAs, S/R levels, extended stats as needed
• Choose dashboard position to avoid chart overlap
• Adjust colors for visibility preferences
═══════════════════════════════════════════════════════════
ALERTS
═══════════════════════════════════════════════════════════
AVAILABLE ALERT CONDITIONS
1. Bullish EMA Cross (Volume Confirmed)
2. Bearish EMA Cross (Volume Confirmed)
3. Strong Bullish Alignment (4+ timeframes)
4. Strong Bearish Alignment (4+ timeframes)
5. Trend Strength Increasing (>16.67% jump)
6. Trend Strength Decreasing (>16.67% drop)
7. Excellent Trade Setup (5-star rating)
Alert messages use standard placeholders:
• {{ticker}} - Symbol name
• {{close}} - Current close price
• {{time}} - Bar timestamp
═══════════════════════════════════════════════════════════
LIMITATIONS & CONSIDERATIONS
═══════════════════════════════════════════════════════════
KNOWN LIMITATIONS
• Lower timeframe data may not be available on all symbols
• 1-minute data typically limited to recent history
• request.security() subject to TradingView data limits
• Dashboard requires screen space (may overlap on small screens)
• More complex calculations may affect load time on slower devices
NOT SUITABLE FOR
• Highly volatile/illiquid instruments (many false signals)
• News-driven markets during announcements
• Automated trading without additional filters
• Markets where EMA strategies don't perform well
DOES NOT PROVIDE
• Exact entry/exit prices
• Stop-loss or take-profit levels
• Position sizing recommendations
• Guaranteed profit signals
• Market predictions
═══════════════════════════════════════════════════════════
BEST PRACTICES
═══════════════════════════════════════════════════════════
RECOMMENDED USAGE
✓ Combine with price action analysis
✓ Use appropriate risk management
✓ Backtest on historical data before live use
✓ Adjust settings for specific market characteristics
✓ Wait for higher-quality setups in important trades
✓ Consider overall market context and fundamentals
NOT RECOMMENDED
✗ Using as standalone trading system without confirmation
✗ Trading every signal without discretion
✗ Ignoring risk management principles
✗ Trading without understanding the methodology
✗ Applying to unsuitable markets/timeframes
═══════════════════════════════════════════════════════════
EDUCATIONAL BACKGROUND
═══════════════════════════════════════════════════════════
EMA CROSSOVER STRATEGY
The Exponential Moving Average crossover is a classical trend-following technique:
• Golden Cross: Fast EMA crosses above Slow EMA (bullish signal)
• Death Cross: Fast EMA crosses below Slow EMA (bearish signal)
• Widely used since the 1970s in various markets
• More responsive than SMA due to exponential weighting
MULTI-TIMEFRAME ANALYSIS
Analyzing multiple timeframes helps traders:
• Identify alignment between short and long-term trends
• Reduce false signals from single-timeframe noise
• Understand market context across different horizons
• Make informed decisions about trade duration
VOLUME ANALYSIS
Volume confirmation adds reliability:
• High volume suggests institutional participation
• Low volume signals may indicate false breakouts
• Volume precedes price in many market theories
• Helps distinguish genuine moves from noise
═══════════════════════════════════════════════════════════
TECHNICAL IMPLEMENTATION
═══════════════════════════════════════════════════════════
CODE STRUCTURE
• Organized in clear sections with proper commenting
• Uses explicit type declarations (int, float, bool, color, string)
• Constants defined at top (BULLISH=1, BEARISH=-1, etc.)
• Functions documented with @function, @param, @returns
• Follows PineCoders naming conventions (camelCase variables)
PERFORMANCE OPTIMIZATION
• var keyword for table (created once, not every bar)
• Calculations cached where possible
• Dashboard updates only on last bar
• Minimal redundant security() calls
SECURITY IMPLEMENTATION
• Proper gaps and lookahead parameters
• No future data leakage
• Signals finalize on bar close
• Historical bars remain static
═══════════════════════════════════════════════════════════
VERSION INFORMATION
═══════════════════════════════════════════════════════════
Current Version: 2.0
Pine Script Version: 5
Last Updated: 2024
Developed by: Zakaria Safri
═══════════════════════════════════════════════════════════
SETTINGS REFERENCE
═══════════════════════════════════════════════════════════
EMA SETTINGS
• Fast EMA Length: 1-500 (default: 20)
• Slow EMA Length: 1-500 (default: 50)
VOLUME & MOMENTUM
• Use Volume Confirmation: true/false (default: true)
• Volume MA Length: 1-500 (default: 20)
• Show RSI Levels: true/false (default: true)
• RSI Length: 1-500 (default: 14)
PRICE ACTION FEATURES
• Show Price Distance: true/false (default: true)
• Show Key Levels: true/false (default: true)
• S/R Lookback Period: 10-500 (default: 50)
DISPLAY SETTINGS
• Show EMAs on Chart: true/false (default: true)
• Fast EMA Color: customizable (default: cyan)
• Slow EMA Color: customizable (default: orange)
• EMA Line Width: 1-5 (default: 2)
• Show Fill Between EMAs: true/false (default: true)
• Show Crossover Signals: true/false (default: true)
DASHBOARD SETTINGS
• Position: Top Left/Right, Bottom Left/Right
• Show Extended Statistics: true/false (default: true)
ALERT SETTINGS
• Alert on Multi-TF Alignment: true/false (default: true)
• Alert on Trend Strength Change: true/false (default: true)
═══════════════════════════════════════════════════════════
RISK DISCLAIMER
═══════════════════════════════════════════════════════════
This indicator is provided for educational and informational purposes only. It should not be considered financial advice or a recommendation to buy or sell any security.
IMPORTANT NOTICES:
• Past performance does not indicate future results
• All trading involves risk of capital loss
• No indicator guarantees profitable trades
• Always conduct independent research and analysis
• Use proper risk management and position sizing
• Consult a qualified financial advisor before trading
• The developer assumes no liability for trading losses
By using this indicator, you acknowledge that you understand these risks and accept full responsibility for your trading decisions.
═══════════════════════════════════════════════════════════
SUPPORT & CONTRIBUTIONS
═══════════════════════════════════════════════════════════
FEEDBACK WELCOME
• Constructive comments appreciated
• Bug reports help improve the indicator
• Feature suggestions considered for future versions
• Share your experience to help other users
OPEN SOURCE
This code is published as open source for the TradingView community to:
• Learn from the implementation
• Modify for personal use
• Understand multi-timeframe analysis techniques
If you find this indicator useful, please consider:
• Leaving a thoughtful review
• Sharing with other traders who might benefit
• Following for future updates and releases
═══════════════════════════════════════════════════════════
ADDITIONAL RESOURCES
═══════════════════════════════════════════════════════════
RECOMMENDED READING
• TradingView Pine Script documentation
• PineCoders community resources
• Technical analysis textbooks on moving averages
• Multi-timeframe trading strategy guides
• Risk management principles
RELATED CONCEPTS
• Trend following strategies
• Moving average convergence/divergence
• Multiple timeframe analysis
• Volume-price relationships
• Momentum indicators
═══════════════════════════════════════════════════════════
Thank you for using this indicator. Trade responsibly and continue learning!
═══════════════════════════════════════════════════════════

Cumulative Hybrid Delta# 📊 CUMULATIVE HYBRID DELTA
## The Most Advanced Volume Delta Indicator for Crypto & Forex Traders
---
## WHAT IS IT?
**Cumulative Hybrid Delta** reveals **who is in control of the market** — buyers or sellers — in real-time. By analyzing volume imbalances and their accumulation over time, this indicator detects market pressure before price moves, giving you the edge you need.
**Stop guessing the market's direction. Start seeing it.**
---
## WHAT IT SHOWS
### 🟢 Buying Pressure
Green signals indicate accumulated buyer dominance. Watch for rising green accumulation in downtrends for reversal opportunities.
### 🔴 Selling Pressure
Red signals show accumulated seller control. Perfect for catching trend exhaustion and potential corrections.
### 💛 Cumulative Delta Line (Yellow)
The heart of the indicator. This line accumulates all delta pressure over your selected period. Rising = bullish momentum building. Falling = bearish pressure intensifying.
### 📊 Delta Bars
Individual bar pressure shown as histogram. Each bar tells you the exact buy/sell imbalance for that candle. Track momentum strength in real-time.
### 🕯️ Wick Analysis
Upper wicks show rejected resistance (seller pressure). Lower wicks reveal bounces from support (buyer pressure). Critical for spotting reversals before they happen.
### ⚡ Extreme Zones (Red & Green Lines)
Auto-calculated overbought and oversold levels. When delta enters these zones, market reversal becomes highly probable. Perfect for taking profits or entering counter-trades.
---
## WHY TRADERS LOVE IT
✅ **5 Hybrid Algorithms** - Switch between different delta calculation methods (Price Position, Wick-Corrected, Close-Open Ratio, Classic, or Full Hybrid)
✅ **Adaptive Technology** - Works perfectly on ANY timeframe and market condition (calm days, volatile days, crypto rallies, forex ranges)
✅ **Spot & Futures Ready** - Whether you trade Bitcoin spot on Binance or micro contracts, this indicator adapts seamlessly
✅ **Real-Time Alerts** - 5 automated alerts catch key turning points so you never miss a setup
✅ **Professional Dashboard** - Live metrics table shows bar delta, cumulative delta, wicks, zone status, and trend at a glance
✅ **Bilingual** - English and Russian interface. Switch languages in settings instantly
✅ **No Repainting** - Calculated from pure OHLCV data. Reliable backtesting. No fake signals
---
## KEY SETTINGS EXPLAINED
### 🧠 DELTA ALGORITHM (Core Feature)
- **Hybrid** (Recommended) - Combines price position (70%) + wick analysis (30%) for maximum accuracy
- **Price Position** - Pure price location in the range (simple & effective)
- **Wick Corrected** - Focuses on rejected pressure (great for reversals)
- **Close-Open** - Traditional bar momentum
- **Classic** - Standard fixed ratio method
### 📊 AGGREGATION TYPE
- **Sum** (Default) - Total delta over period (best for signals)
- **SMA** - Smoothed average (cleaner chart)
- **EMA** - Exponential weighted (faster response)
- **Cumulative** - Pure running total (academic analysis)
### 🤖 ADAPTIVE MODES
- **ATR-Based** (Recommended) - Adjusts to volatility using Average True Range
- **Volatility-Based** - Uses standard deviation for adaptation
- **Range-Based** - Adjusts to candle size
**Why adaptive?** Because a signal on a calm day is different from a signal on an explosive rally. The indicator learns your market and adapts automatically.
### ⚡ CUSTOMIZATION
- Change all colors to match your chart theme
- Adjust zone sensitivity (manual or auto)
- Choose number format (K, M, B notation or full numbers)
- Display in USD or volume units
- Pick table position (9 locations available)
- Set font size (tiny to huge)
---
## WHAT YOU GET AT A GLANCE
**The Live Metrics Table Shows:**
- Current bar delta (buy vs sell pressure RIGHT NOW)
- Cumulative delta (accumulated pressure over time)
- Delta % (strength of pressure as a percentage)
- Upper wick (rejected resistance)
- Lower wick (bounces from support)
- Adaptive coefficient (volatility multiplier)
- Zone status (OVERBOUGHT / NORMAL / OVERSOLD)
- Trend direction (RISING / FALLING / FLAT)
**All updated in real-time. All on one clean dashboard.**
---
## THE 5 TRADING SIGNALS
1. **Zero Cross Alert** - Cumulative delta crosses zero = momentum shift detected
2. **Overbought Alert** - Enters red zone = buyers exhausted, sell signal
3. **Oversold Alert** - Enters green zone = sellers exhausted, buy signal
4. **Bullish Delta** - Bar delta turns positive = buying starts
5. **Bearish Delta** - Bar delta turns negative = selling starts
**Each alert can trigger notifications on your phone. Never miss a setup again.**
---
## WHO SHOULD USE THIS?
✅ **Crypto Traders** - Bitcoin, Ethereum, Altcoins (spot and futures)
✅ **Forex Traders** - EUR/USD, GBP/USD, and all pairs
✅ **Scalpers** - 1m-5m timeframes with instant alerts
✅ **Day Traders** - 15m-1h for quick reversals and continuations
✅ **Swing Traders** - 4h-1d for major trend changes
✅ **Position Traders** - Weekly/monthly for macro reversals
**Works on all timeframes. All markets. All strategies.**
---
## WHAT MAKES IT DIFFERENT?
While 99% of volume indicators just show raw volume, **Cumulative Hybrid Delta** does something revolutionary:
- It separates BUYING volume from SELLING volume with precision
- It accumulates this pressure to show market intention
- It adapts to your specific market and timeframe
- It alerts you to extremes before they reverse
- It works on crypto, forex, stocks, futures — everything
**This is what institutional traders pay thousands for. Now it's free.**
---
## QUICK START
1. Add to chart (search "Cumulative Hybrid Delta" on TradingView)
2. Open settings
3. Choose your algorithm (recommend starting with "Hybrid")
4. Set your timeframe
5. Watch the magic happen
**First signal comes within minutes. First reversal catch comes today.**
---
## PROVEN ON
✅ Bitcoin (1m, 5m, 15m, 1h, 4h, 1d)
✅ Altcoins (Ethereum, Solana, XRP, and 100+ pairs)
✅ Forex (EURUSD, GBPUSD, GOLD, CRYPTO pairs)
✅ All exchanges (Binance, OKX, Bybit, Coinbase, Kraken)
✅ All market conditions (bullish, bearish, ranging, volatile)
---
## START TRADING SMARTER TODAY
Stop trading blind. Stop guessing market direction.
**Cumulative Hybrid Delta** shows you exactly where the power is. Whether buyers or sellers are winning. When reversals are coming. When to enter. When to take profit.
**Download now. Change your trading forever.**
---
## FEATURES SNAPSHOT
| Feature | Details |
|---------|---------|
| **Algorithms** | 5 professional delta calculation methods |
| **Timeframes** | 1m to 1M (all supported) |
| **Markets** | Crypto, Forex, Stocks, Futures, Commodities |
| **Alerts** | 5 automated trading signals |
| **Adaptation** | 3 automatic market-condition adjustments |
| **Languages** | English & Russian |
| **Customization** | 50+ adjustable settings |
| **Dashboard** | 9-metric live table with zone status |
| **Colors** | Fully customizable to match any chart |
| **Performance** | Zero repainting, pure OHLCV calculation |
---
---
## READY TO DOMINATE?
**Your edge is waiting.**
This indicator gives professional-grade volume analysis at zero cost. Institutional traders charge thousands for this insight. You get it free.
**Download Cumulative Hybrid Delta now and see what professional traders see.**
---
*Cumulative Hybrid Delta - Where Smart Money Meets Retail Traders*
**Available exclusively on TradingView. Free. Forever. No subscription. No hidden costs.**

My setup [Pro] (fadi)My Setup is a powerful TradingView indicator that visualizes your trading strategy, helping you find high-probability setups with precision and discipline. It combines Higher Timeframe (HTF) context with Lower Timeframe (LTF) entries on a single chart, streamlining your trading process.
What It Does
Tracks your chosen timeframe and its paired higher timeframe for custom trade setups, so you don’t have to stay glued to the screen.
Plots clear Entry, Stop Loss, and Take Profit levels when your conditions align.
Customizes to your strategy with HTF triggers (e.g., sweeps, liquidity grabs) and LTF entries (e.g., Order Blocks, FVGs, Breakers).
Ensures discipline by only showing setups that meet all your rules, eliminating emotional trading and FOMO.
Backtest your edge by visualizing past setups to refine entries, stops, and confluences.
How It Works
Set Your HTF Trigger: Choose a market event like a sweep of a high/low, pivot point, or liquidity grab on the paired higher timeframe (e.g., 1H for a 5m chart).
Define Your LTF Entry: Select your entry model from a range of institutional concepts, such as Order Block, Fair Value Gap (FVG), Inverted FVG (iFVG), Breaker Block, Unicorn Model, and more, on the chart’s timeframe.
Add Confluence Filters: Stack conditions like requiring an FVG + Breaker for higher-probability setups.
See It on Your Chart: When a setup forms, it’s instantly plotted with Entry, Stop Loss, and Take Profit levels based on your Risk-to-Reward ratio.
Key Features
Multi-Timeframe Sync: Pair your chart’s timeframe (e.g., 5m) with a higher timeframe (e.g., 1H) for seamless analysis.
Institutional Tools: Supports a comprehensive suite of ICT concepts, including Order Blocks, FVGs, iFVGs, Breakers, Unicorn Model, and additional entry models.
Custom Risk Management: Set your Stop Loss and Take Profit levels with fixed R:R or measured moves using large range of entry and stop levels.
Session Filtering: Limit setups to specific trading sessions (e.g., London, New York) with timezone support.
Visual Clarity: Displays HTF candles and key levels on your chart for context, with customizable colors and styles.
Alerts: Get notified the moment a valid setup appears, even on live candles.
Who It’s For
Traders who want to systematize their ICT-based strategy on a single chart.
Those seeking to trade with discipline and avoid impulsive decisions.
Anyone looking to backtest and optimize their setups with clear, visual feedback.
Busy traders who need a tool to track their chart while they focus on life.
Why Choose My Setup ?
Save Time: Let the indicator track your chart and its paired timeframe.
Trade Confidently: Only take A+ setups that match your exact rules.
Learn and Improve: Analyze historical setups to refine your strategy.
Disclaimer of Warranties and Limitation of Liability for [My Setup ]
Please read this disclaimer carefully before using the [My Setup ] indicator (hereafter referred to as "the Software").
1. No Financial Advice
The Software is provided for educational and informational purposes only. The data, calculations, and signals generated by the Software are not, and should not be interpreted as, financial advice, investment advice, trading advice, or a recommendation or solicitation to buy, sell, or hold any security or financial instrument.
2. Assumption of Risk You acknowledge that trading and investing are inherently risky activities that carry a high potential for significant financial loss. All actions you take in the market, including but not limited to trade execution and risk management, are your sole responsibility. You agree to use the Software at your own sole risk. The creator shall not be held responsible or liable for any financial losses or damages you may incur as a result of using the Software.
3. No Warranty; "AS IS" Provision
The Software is provided "AS IS" and "AS AVAILABLE", without any warranties of any kind, either express or implied. The creator disclaims all warranties, including, but not limited to, implied warranties of merchantability, fitness for a particular purpose, accuracy, timeliness, completeness, and non-infringement.
The creator does not warrant that the Software will be error-free, uninterrupted, secure, or free of bugs, viruses, or other harmful components. You acknowledge that software is never wholly free from defects, and you are responsible for implementing your own procedures for data accuracy and security.
4. Limitation of Liability
TO THE MAXIMUM EXTENT PERMITTED BY APPLICABLE LAW, IN NO EVENT SHALL THE CREATOR, FADI ZEIDAN, BE LIABLE FOR ANY CLAIM, DAMAGES, OR OTHER LIABILITY, WHETHER IN AN ACTION OF CONTRACT, TORT, OR OTHERWISE, ARISING FROM, OUT OF, OR IN CONNECTION WITH THE SOFTWARE OR THE USE OR OTHER DEALINGS IN THE SOFTWARE.
This limitation of liability applies to any and all damages, including but not limited to:
Direct, indirect, incidental, special, consequential, or exemplary damages.
Loss of profits, revenue, data, or use.
Financial losses resulting from trading decisions made based on the Software.
Damages arising from software defects, interruptions, or inaccuracies.
5. Indemnification
You agree to indemnify, defend, and hold harmless the creator, Fadi Zeidan, from and against any and all claims, liabilities, damages, losses, or expenses, including reasonable attorneys' fees and costs, arising out of or in any way connected with your access to or use of the Software.
6. Acknowledgment and Agreement
By accessing, installing, or using the [My Setup ] indicator, you acknowledge that you have read, understood, and agree to be bound by the terms of this disclaimer. If you do not agree with these terms, you must not use the Software.
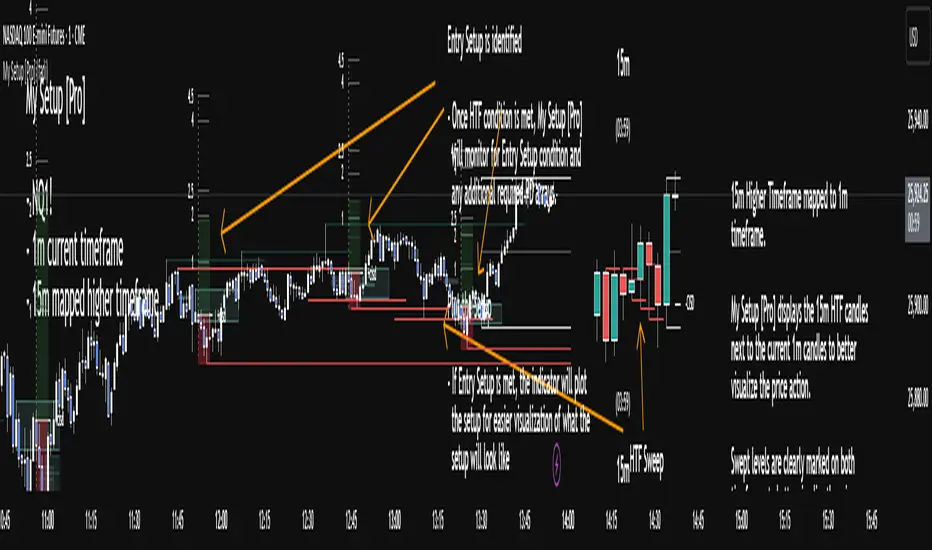
TRADER JUMBLO SIGNAL — Dip & Rally System“Buy from the roots, sell from the peaks.”
A precision-built smart trading system that detects market dips and rallies — allowing you to catch reversals right from the turning points, not halfway through the move.
🧠 How It Works (Concept Overview — no code)
The TRADER JUMBLO SIGNAL system combines trend-following and reversal-detection logic into one tool.
It analyses the last few bars (adjustable Lookback Period) to identify local extremes — the “roots” and “peaks” — and confirms entries using price structure and moving averages.
When conditions align:
-🟢 BUY Signal: Detected near the local lowest low within the lookback period during an uptrend.
-🔴 SELL Signal: Detected near the highest high during a downtrend.
-Each trade automatically sets a dynamic Stop Loss and Take Profit using the ATR (volatility-based).
-Intrabar or close-confirmed entries can be toggled for aggressive or conservative trading styles.
This system ensures you don’t chase candles — instead, it times entries at the core reversal points of the market structure.
⚙️ Key Features
-Dip & Rally Detection: Finds local highs/lows (roots and peaks) within an adjustable lookback window.
-Trend Filter: Only trades in the direction of the dominant moving-average trend.
-Intrabar Mode: Option to allow real-time entries before the candle closes.
-RSI Filter (optional): Filters out weak or overbought/oversold setups.
- ATR-based SL & TP: Automatic volatility-adjusted Stop Loss and Take Profit.
- Smart Table Display: Real-time info panel showing Entry, SL, TP, Lowest, Highest, Tolerance %, and Lookback bars.
-Customizable UI: Enable/disable labels, markers, and SL/TP lines.
Built-in Alerts:
✅ Buy (Dip) Trigger
❌ Sell (Rally) Trigger
🎯 TP Hit
🛑 SL Hit
📊 What Makes It Unique
Unlike basic crossover or RSI systems, this indicator focuses on price reaction around extremes — meaning you enter where reversals start, not after they’ve already moved.
It helps prevent:
Late entries after momentum is gone
Buying tops / selling bottoms
Random entries without market structure context
Instead, you’ll see:
Clean entries from the “roots” (local dips)
Exits or reversals from the “peaks” (local rallies)
Visual feedback for SL/TP hits — so you learn from each setup instantly.
📈 Visuals
🟢 Green markers = BUY entries near local lows.
🔴 Red markers = SELL entries near local highs.
✅ “TP Hit” or ❌ “SL Hit” labels appear on price touch.
🟦 Floating table on chart shows live trade info and state (LONG / SHORT / FLAT).
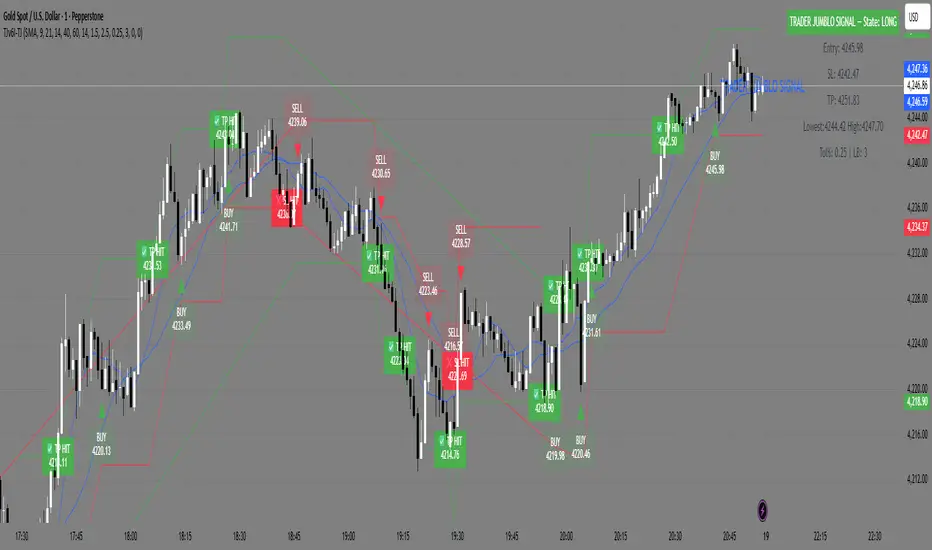
Nexus Breakout System💎 What Makes the Nexus Breakout System Special?
Many indicators can draw a box around a price range, but most are one-dimensional. The Nexus Breakout System (NBS) is different. Its edge comes from a sophisticated, multi-layered approach to analyzing market behavior.
Think of it as moving from a flat map to a 3D holographic view of the market.
1. A Deeper Understanding of "Consolidation"
Instead of just looking at highs and lows, the NBS engine analyzes three critical dimensions to qualify a true consolidation zone:
Price Range: Is the market truly range-bound?
Order Flow: Is there a balance between buying and selling pressure? (It looks at the engine of the market, not just the price).
Momentum: Is the market lacking directional energy?
By requiring all three conditions to be met, NBS identifies zones where significant energy is genuinely building up, leading to more reliable breakout signals.
2. The "Nexus Bias" — Anticipating the Next Move
This is the core of the engine. While price is consolidating, NBS is constantly analyzing the underlying currents of the market. It calculates a proprietary Bias Score by looking at:
Underlying Trend Structure: What is the "path of least resistance" on a micro-level?
Money Flow Dynamics: Who is winning the quiet battle inside the range—buyers or sellers?
This score is translated into a simple " Bullish Lean ," " Bearish Lean ," or " Neutral " reading right on your chart. It’s designed to give you an intelligent hint about the breakout's most likely direction before it happens.
3. Statistical Breakout Confirmation — Reducing False Signals
Most indicators signal a breakout on a simple price cross, which is why fakeouts are so common. NBS uses a statistical method known as CUSUM (Cumulative Sum Control Chart) to validate a breakout.
In simple terms, it waits for a true "change of character" in the price action. The signal is designed to trigger only when the market moves from a state of balance (consolidation) to a state of imbalance (trending), providing a much higher degree of confidence.
---
📜 How to Trade with the Nexus Edge: A Strategic Framework
Trading with NBS is about combining its signals into a coherent, high-probability strategy.
Step 1: Identify the Opportunity (The Zone & The Bias)
Wait for the script to draw a Nexus Box. This is your signal that a market is coiling for a potential move.
Check the intraday bias within the box. A zone showing a " Bullish Lean " in a larger uptrend is a higher-quality setup than one that is " Neutral ." This is your first clue.
Step 2: Consult the Strategist (The Analysis Panel)
This step is crucial. Always check the Strategic Analysis Panel before considering a trade. This panel acts as your personal market strategist.
Look for Alignment: The highest probability trades occur when the chart signal aligns with the panel's insight.
A+ Setup Example: The panel shows a " Dominant Bull Trend " for the 1H/4H, and your 15-minute chart forms a Nexus Box with a " Bullish Lean ." A breakout to the upside is a very strong, A+ signal.
Warning Signal: The panel warns of a " Major Trend Conflict " (e.g., Daily is bullish, 4H is bearish). You should be extremely cautious. Any breakout during this condition is lower probability and should be traded with smaller size or avoided entirely.
Step 3: Execute the Breakout (The Entry)
The classic entry is on the close of the candle that breaks out of the Nexus Box.
Confirmation: The box's border will change color (blue for bullish, pink for bearish), visually confirming the breakout is active.
Targets: Your initial profit targets (T1 and T2) are immediately plotted. T1 is often an excellent level to take partial profits and move your stop-loss to break even.
Step 4: Manage the Trade (The "Breakout Failure" Guard)
This is your safety net. After a breakout, the script monitors the health of the move.
If you receive a " Breakout Failure " alert, it is a critical warning that momentum is failing and the move may be a trap.
Actionable Signal: Use this alert to aggressively manage your trade. It could be a signal to:
Tighten your stop-loss immediately.
Close the trade to protect your capital.
Take profits if the price is hesitating near a key level.

Entry (MTF) - Three phase Reversal patternOf course. We can absolutely reframe the explanation to give the strategy a more unique or generalized name, focusing on the concepts rather than the specific mentor.
Here is a revised, in-depth guide for your "Entry(MTF)" indicator, presented as the **"Momentum Shift Entry Model."**
***
### Entry (MTF) Indicator: A Guide to the Momentum Shift Model
This powerful indicator is designed to automatically detect a high-probability **Momentum Shift Entry Pattern**. The core strategy is to identify moments where the market's direction is likely to make a significant and sustained reversal, often driven by institutional order flow.
The indicator's key advantage is its **Multi-Timeframe (MTF)** functionality. It allows you to find these robust setups on a higher timeframe (like the daily chart) and then projects those signals onto your active, lower timeframe chart (like the 15-minute), providing a clear strategic edge for timing your entries.
---
## The Core Logic: The Three-Phase Reversal Pattern
This indicator is not based on a simple lagging condition. It looks for a specific three-step sequence of events. This sequence validates a genuine shift in market control from sellers to buyers (or vice-versa), filtering out false moves.
### Step 1: The Liquidity Purge 🎯
First, the indicator identifies recent, significant swing highs and lows on the chart. These price levels are natural magnets for liquidity, as many traders place their stop-loss orders there.
* **A Bullish Setup** begins when the price first dips **below a recent swing low**. This action is often an engineered move to "purge" or "sweep" the sell-side liquidity resting there before a move higher.
* **A Bearish Setup** begins with a price spike **above a recent swing high**, clearing out the buy-side liquidity.
This initial phase is designed to trap traders on the wrong side of the market before the true move begins.
### Step 2: The Market Structure Shift (The Confirmation) 🔄
After the liquidity has been taken, the indicator needs confirmation that a real power shift has occurred. This is confirmed by a **Market Structure Shift (MSS)**.
* After a **bullish purge (of a low)**, an MSS is confirmed when the price aggressively rallies and closes **above a recent swing *high***. This proves that buyers have not only absorbed all the selling but are now strong enough to break previous resistance levels.
* After a **bearish purge (of a high)**, an MSS is confirmed when the price falls and closes **below a recent swing *low***, showing that sellers are now decisively in command.
### Step 3: The Price Imbalance (The Entry Zone) GAP) is created during the same powerful move that caused the Market Structure Shift. A Fair Value Gap, or **price imbalance**, is a three-candle pattern that signifies a very aggressive, one-sided move, leaving a gap in the market that price will often seek to re-fill.
This FVG acts as the signature of institutional activity and becomes a high-probability zone for planning a trade entry.
---
## How to Use the Indicator in Your Trading
The true strength of this indicator lies in combining the higher-timeframe signal with the immediate context of your trading timeframe.
### Reading the Signals and Visuals
* **`BUY` / `SELL` Labels:** These are your primary signals, generated from the **"Signal Timeframe"** you select (e.g., Daily). A "BUY" label indicates that the complete three-phase bullish pattern has been confirmed on that higher timeframe.
* **Dotted Lines (Liquidity Levels):** The red and green dotted lines on your chart mark the most recent swing high and low on your **current timeframe**. These are the levels to watch for a potential "Liquidity Purge."
* **Colored Boxes (Imbalance Zones):** The green (bullish) and red (bearish) boxes highlight the Fair Value Gaps on your **current timeframe**. These are your potential entry zones.
### A Potential Trading Strategy
1. **Set Your Signal Timeframe:** Choose a higher timeframe that you use to define the overall trend (e.g., 'D' for daily, '4H' for 4-hour).
2. **Wait for an HTF Signal:** Patiently wait for a `BUY` or `SELL` label to appear. This is your cue to begin actively looking for an entry.
3. **Find a Local Entry Zone:** Once a `BUY` signal from the higher timeframe appears, look for the price on your current chart to retrace into a nearby **bullish FVG (green box)**. For a `SELL` signal, look for a pullback into a **bearish FVG (red box)**.
4. **Entry:** Plan your entry as the price tests this imbalance zone.
5. **Stop Loss:** A logical stop loss is critical. For a buy trade, place your stop below the swing low that was formed during the MSS. For a sell trade, place it above the corresponding swing high.
6. **Take Profit:** Aim for a significant liquidity level on a higher timeframe or use a predetermined risk-to-reward ratio (e.g., 1:2, 1:3).
---
## Customizing the Settings
* **`Signal Timeframe`**: The most critical setting. It determines the timeframe from which the core buy/sell logic originates. A Daily signal will carry more weight than an H1 signal.
* **`Liquidity/MSS Lookback`**: This controls the significance of the swing points the indicator uses.
* **Higher value:** Finds major, long-term swing points, leading to fewer but more powerful signals.
* **Lower value:** Finds minor, short-term swing points, leading to more frequent but potentially less reliable signals.
* **`Show Current TF Fair Value Gaps`**: This toggles the visibility of the imbalance zones (FVG boxes) on your chart. It is highly recommended to keep this enabled to easily spot your entry areas.

Session VWAP & ATR H/L ZonesThis script is a comprehensive tool for day traders, designed to visualize key price levels and zones based on volume and volatility within a specific trading session.
Traders would use your script to identify potential areas of support and resistance, gauge the session's trend, and spot opportunities for mean reversion or breakout trades.
Core Concepts Explained
Your script plots three main types of information on the chart, each serving a different purpose for a trader.
1. Session VWAP (Volume-Weighted Average Price) 📈
What it is: The yellow line is the VWAP, which is the average price of an asset for the current trading session, weighted by the volume traded at each price level. It essentially shows the "fair" price for the day according to the market's activity.
How it's used:
Trend Gauge: If the price is consistently trading above the VWAP, it's generally considered a bullish intraday trend. If it's below, the trend is bearish.
Dynamic Support/Resistance: During a trend, traders often look for the price to pull back to the VWAP to find an entry point (e.g., buying a dip to the VWAP in an uptrend).
VWAP Bands: The optional gray, red, and green bands are standard deviations from the VWAP. They measure how far the price has strayed from its "fair value."
2. ATR High/Low Zones (Support & Resistance) 🎯
What they are: These are the shaded green and red areas at the top and bottom of the session's price range.
The red zone (resistance) is calculated by taking the session's current high and subtracting a value based on the Average True Range (ATR), which is a measure of recent volatility.
The green zone (support) is calculated by taking the session's current low and adding the ATR-based value.
How they're used: These are not just lines; they are zones of interest.
Profit-Taking Areas: A trader who is long might consider taking profits when the price enters the red resistance zone.
Reversal Signals: When the price enters one of these zones and shows signs of stalling (e.g., with specific candlestick patterns), it could signal a potential reversal.
3. Previous Session High & Low 📊
What they are: The script plots the high and low from the previous trading session as straight horizontal lines (teal and fuchsia by default).
How they're used: These are extremely significant static levels that many traders watch.
Price Magnets: Price is often drawn to these levels.
Key Inflection Points: A decisive break above the previous day's high can signal strong bullish momentum. Conversely, a failure to break it can indicate weakness. These levels frequently act as strong support or resistance.

Seasonality Heatmap [QuantAlgo]🟢 Overview
The Seasonality Heatmap analyzes years of historical data to reveal which months and weekdays have consistently produced gains or losses, displaying results through color-coded tables with statistical metrics like consistency scores (1-10 rating) and positive occurrence rates. By calculating average returns for each calendar month and day-of-week combination, it identifies recognizable seasonal patterns (such as which months or weekdays tend to rally versus decline) and synthesizes this into actionable buy low/sell high timing possibilities for strategic entries and exits. This helps traders and investors spot high-probability seasonal windows where assets have historically shown strength or weakness, enabling them to align positions with recurring bull and bear market patterns.
🟢 How It Works
1. Monthly Heatmap
How % Return is Calculated:
The indicator fetches monthly closing prices (or Open/High/Low based on user selection) and calculates the percentage change from the previous month:
(Current Month Price - Previous Month Price) / Previous Month Price × 100
Each cell in the heatmap represents one month's return in a specific year, creating a multi-year historical view
Colors indicate performance intensity: greener/brighter shades for higher positive returns, redder/brighter shades for larger negative returns
What Averages Mean:
The "Avg %" row displays the arithmetic mean of all historical returns for each calendar month (e.g., averaging all Januaries together, all Februaries together, etc.)
This metric identifies historically recurring patterns by showing which months have tended to rise or fall on average
Positive averages indicate months that have typically trended upward; negative averages indicate historically weaker months
Example: If April shows +18.56% average, it means April has averaged a 18.56% gain across all years analyzed
What Months Up % Mean:
Shows the percentage of historical occurrences where that month had a positive return (closed higher than the previous month)
Calculated as:
(Number of Months with Positive Returns / Total Months) × 100
Values above 50% indicate the month has been positive more often than negative; below 50% indicates more frequent negative months
Example: If October shows "64%", then 64% of all historical Octobers had positive returns
What Consistency Score Means:
A 1-10 rating that measures how predictable and stable a month's returns have been
Calculated using the coefficient of variation (standard deviation / mean) - lower variation = higher consistency
High scores (8-10, green): The month has shown relatively stable behavior with similar outcomes year-to-year
Medium scores (5-7, gray): Moderate consistency with some variability
Low scores (1-4, red): High variability with unpredictable behavior across different years
Example: A consistency score of 8/10 indicates the month has exhibited recognizable patterns with relatively low deviation
What Best Means:
Shows the highest percentage return achieved for that specific month, along with the year it occurred
Reveals the maximum observed upside and identifies outlier years with exceptional performance
Useful for understanding the range of possible outcomes beyond the average
Example: "Best: 2016: +131.90%" means the strongest January in the dataset was in 2016 with an 131.90% gain
What Worst Means:
Shows the most negative percentage return for that specific month, along with the year it occurred
Reveals maximum observed downside and helps understand the range of historical outcomes
Important for risk assessment even in months with positive averages
Example: "Worst: 2022: -26.86%" means the weakest January in the dataset was in 2022 with a 26.86% loss
2. Day-of-Week Heatmap
How % Return is Calculated:
Calculates the percentage change from the previous day's close to the current day's price (based on user's price source selection)
Returns are aggregated by day of the week within each calendar month (e.g., all Mondays in January, all Tuesdays in January, etc.)
Each cell shows the average performance for that specific day-month combination across all historical data
Formula:
(Current Day Price - Previous Day Close) / Previous Day Close × 100
What Averages Mean:
The "Avg %" row at the bottom aggregates all months together to show the overall average return for each weekday
Identifies broad weekly patterns across the entire dataset
Calculated by summing all daily returns for that weekday across all months and dividing by total observations
Example: If Monday shows +0.04%, Mondays have averaged a 0.04% change across all months in the dataset
What Days Up % Mean:
Shows the percentage of historical occurrences where that weekday had a positive return
Calculated as:
(Number of Positive Days / Total Days Observed) × 100
Values above 50% indicate the day has been positive more often than negative; below 50% indicates more frequent negative days
Example: If Fridays show "54%", then 54% of all Fridays in the dataset had positive returns
What Consistency Score Means:
A 1-10 rating measuring how stable that weekday's performance has been across different months
Based on the coefficient of variation of daily returns for that weekday across all 12 months
High scores (8-10, green): The weekday has shown relatively consistent behavior month-to-month
Medium scores (5-7, gray): Moderate consistency with some month-to-month variation
Low scores (1-4, red): High variability across months, with behavior differing significantly by calendar month
Example: A consistency score of 7/10 for Wednesdays means they have performed with moderate consistency throughout the year
What Best Means:
Shows which calendar month had the strongest average performance for that specific weekday
Identifies favorable day-month combinations based on historical data
Format shows the month abbreviation and the average return achieved
Example: "Best: Oct: +0.20%" means Mondays averaged +0.20% during October months in the dataset
What Worst Means:
Shows which calendar month had the weakest average performance for that specific weekday
Identifies historically challenging day-month combinations
Useful for understanding which month-weekday pairings have shown weaker performance
Example: "Worst: Sep: -0.35%" means Tuesdays averaged -0.35% during September months in the dataset
3. Optimal Timing Table/Summary Table
→ Best Month to BUY: Identifies the month with the lowest average return (most negative or least positive historically), representing periods where prices have historically been relatively lower
Based on the observation that buying during historically weaker months may position for subsequent recovery
Shows the month name, its average return, and color-coded performance
Example: If May shows -0.86% as "Best Month to BUY", it means May has historically averaged -0.86% in the analyzed period
→ Best Month to SELL: Identifies the month with the highest average return (most positive historically), representing periods where prices have historically been relatively higher
Based on historical strength patterns in that month
Example: If July shows +1.42% as "Best Month to SELL", it means July has historically averaged +1.42% gains
→ 2nd Best Month to BUY: The second-lowest performing month based on average returns
Provides an alternative timing option based on historical patterns
Offers flexibility for staged entries or when the primary month doesn't align with strategy
Example: Identifies the next-most favorable historical buying period
→ 2nd Best Month to SELL: The second-highest performing month based on average returns
Provides an alternative exit timing based on historical data
Useful for staged profit-taking or multiple exit opportunities
Identifies the secondary historical strength period
Note: The same logic applies to "Best Day to BUY/SELL" and "2nd Best Day to BUY/SELL" rows, which identify weekdays based on average daily performance across all months. Days with lowest averages are marked as buying opportunities (historically weaker days), while days with highest averages are marked for selling (historically stronger days).
🟢 Examples
Example 1: NVIDIA NASDAQ:NVDA - Strong May Pattern with High Consistency
Analyzing NVIDIA from 2015 onwards, the Monthly Heatmap reveals May averaging +15.84% with 82% of months being positive and a consistency score of 8/10 (green). December shows -1.69% average with only 40% of months positive and a low 1/10 consistency score (red). The Optimal Timing table identifies December as "Best Month to BUY" and May as "Best Month to SELL." A trader recognizes this high-probability May strength pattern and considers entering positions in late December when prices have historically been weaker, then taking profits in May when the seasonal tailwind typically peaks. The high consistency score in May (8/10) provides additional confidence that this pattern has been relatively stable year-over-year.
Example 2: Crypto Market Cap CRYPTOCAP:TOTALES - October Rally Pattern
An investor examining total crypto market capitalization notices September averaging -2.42% with 45% of months positive and 5/10 consistency, while October shows a dramatic shift with +16.69% average, 90% of months positive, and an exceptional 9/10 consistency score (blue). The Day-of-Week heatmap reveals Mondays averaging +0.40% with 54% positive days and 9/10 consistency (blue), while Thursdays show only +0.08% with 1/10 consistency (yellow). The investor uses this multi-layered analysis to develop a strategy: enter crypto positions on Thursdays during late September (combining the historically weak month with the less consistent weekday), then hold through October's historically strong period, considering exits on Mondays when intraweek strength has been most consistent.
Example 3: Solana BINANCE:SOLUSDT - Extreme January Seasonality
A cryptocurrency trader analyzing Solana observes an extraordinary January pattern: +59.57% average return with 60% of months positive and 8/10 consistency (teal), while May shows -9.75% average with only 33% of months positive and 6/10 consistency. August also displays strength at +59.50% average with 7/10 consistency. The Optimal Timing table confirms May as "Best Month to BUY" and January as "Best Month to SELL." The Day-of-Week data shows Sundays averaging +0.77% with 8/10 consistency (teal). The trader develops a seasonal rotation strategy: accumulate SOL positions during May weakness, hold through the historically strong January period (which has shown this extreme pattern with reasonable consistency), and specifically target Sunday exits when the weekday data shows the most recognizable strength pattern.
